
|
|
The Intensive Stream Biosurvey is based on the habitat assessment and macroinvertebrate sampling approach developed by EPA in its Rapid Bioassessment Protocols for Streams and Rivers (Protocol II) and adapted by volunteer monitoring programs such as Maryl and Save Our Streams and River Watch Network.
Like the Stream Habitat Walk and Streamside Biosurvey, this approach includes a study of macroinvertebrates and habitat. However, the Intensive Stream Biosurvey approach is more rigorous; it requires substantial volunteer training in habitat and macroinve rtebrate sampling methods and in macroinvertebrate identification. This approach also requires the involvement of a stream biologist to advise the program participants regarding everything from the selection of reference conditions to taxonomy and data an alysis.
Because of the need for training and professional assistance, the Intensive Stream Biosurvey approach can be expensive and labor-intensive for the volunteer program. Its benefits, however, are equally clear: with proper quality control and volunteer train ing, the Intensive Stream Biosurvey can yield credible information on subtle stream impacts and water quality trends. Key features of the Intensive Stream Biosurvey are as follows:
Issues that should be considered in planning the program include the following:
Provide detailed hand-drawn maps of the locations selected to the monitors. Know the latitude and longitude of your monitoring locations. This is critical for mapping and for many data management programs. Latitude and longitude can be calculated manually (see Appendix C) or by using a hand-held Global Positioning System (GPS).
Another factor to keep in mind is weather. It is best to wait at least a week after a heavy rain or snow event before sampling. Heavy rains can have a scouring effect on macroinvertebrates, washing them downstream. If this happens, samples collected will not accurately reflect biological conditions. However, if you are studying the possible impact of runoff from a particular source (such as a construction site), you might decide to sample within a short time after heavy precipitation.
|
|
Rocky-bottom streams are defined as those with bottoms made up of gravel, cobbles, and boulders in any combination. They usually have definite riffle areas. Riffle areas are fairly well oxygenated and, therefore, are prime habitats for benthic macroinvert ebrates. In these streams, use the Rocky-Bottom sampling method.
Muddy-bottom streams have muddy, silty, or sandy bottoms that lack riffles. Usually, these are slow-moving, low-gradient streams (i.e., streams that flow along flat terrain). In such streams, macroinvertebrates generally attach to overhanging plants, root s, logs, submerged vegetation, and stream substrate where organic particles are trapped. In these streams, use the Muddy Bottom sampling method.
Each method is detailed below. Regardless of which collection method is used, the process for counting, identifying, and analyzing the macroinvertebrate sample for the Intensive Stream Biosurvey is the same. Following the discussion of both approaches to macroinvertebrate collection and habitat assessment procedures is a section on analyzing the sample.
| Rocky-Bottom Streams Part1: Macroinvertebrate Sampling Method |
Use the following method of macroinvertebrate sampling in streams that have riffles and gravel/cobble substrates. You will collect three samples at each site and composite them to obtain one large total sample.
Mark off your 100-yard stream site. If possible, it should begin at least 50 yards upstream of any human-made modification of the channel, such as a bridge, dam, or pipeline crossing, Avoid walking in the stream, since this might dislodge macroinvertebrat es and alter your sampling results.
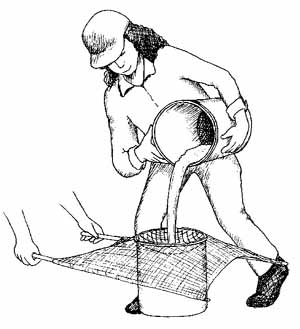 Figure 4.16 Pouring sample water through the net |
Bucket #2 captured the water and any organisms that might have fallen through the netting during pouring. As a final check, repeat the process above, but this time, pour bucket #2 over the net, into bucket #1. Transfer any organisms on the net into the ja r.
| Rocky-Bottom Streams Part 2: Habitat Assessment Method |
You will conduct a habitat assessment (which will include measuring general characteristics and local land use) in a 100-yard section of stream that includes the riffles from which organisms were collected.
General Characteristics
Local Land Use
The first two parameters should be assessed directly at the riffle(s) or run(s) that were used for the macroinvertebrate sampling.
To estimate the percent of embeddedness, observe the amount of silt or finer sediments overlying and surrounding the rocks. If kicking does not dislodge the rocks or cobbles, they might be greatly embedded.
Sediments are naturally deposited in areas where the stream flow is reduced, such as pools and bends, or where flow is obstructed. These deposits can lead to the formation of islands, shoals, or point bars (sediments that build up in the stream, usually a t the beginning of a meander) or can result in the complete filling of pools. To determine whether these sediment deposits are new, look for vegetation growing on them: new sediments will not yet have been colonized by vegetation.
Measure stream velocity by marking off a 10-foot section of stream run and measuring the time it takes a stick, orange, or other floating biodegradable object to float the 10 feet. Repeat 5 times, in the same 10-foot section, and determine the average tim e. Divide the distance (10 feet) by the average time (seconds) to determine the velocity in feet per second.
Measure the stream depth by using a stick of known length and taking readings at various points within your stream site, including riffles, runs, and pools. Compare velocity and depth at various points within the 100-yard site to see how many of the combi nations are present.
A wide, relatively undisturbed riparian vegetative zone reflects a healthy stream system; narrow, far less useful riparian zones occur when roads, parking lots, fields, lawns, and other artificially cultivated areas, bare soil, rocks, or buildings are nea r the stream bank. The presence of "old fields" (i.e., previously developed agricultural fields allowed to revert to natural conditions) should rate higher than fields in continuous or periodic use. In arid areas, the riparian vegetative zone can be measu red by observing the width of the area dominated by riparian or water-loving plants, such as willows, marsh grasses, and cottonwood trees.
| Muddy-Bottom Sampling Part 1: Macroinvertebrate Sampling |
In muddy-bottom streams, as in rocky- bottom streams, the goal is to sample the most productive habitat available and look for the widest variety of organisms. The most productive habitat is the one that harbors a diverse population of pollution-sensitive macroinvertebrates. Volunteers should sample by using a D-frame net to jab at the habitat and scoop up the organisms that are dislodged. The idea is to collect a total sample that consists of 20 jabs taken from a variety of habitats.
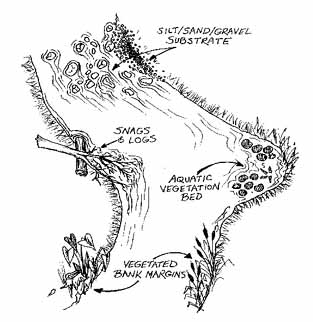 Figure 4.17 Four habitats found in muddy-bottom streams Volunteers will likely find the most macroinvertebrates in vegetated habitats and snags and logs. |
This method of sampling requires only one person to disturb the stream habitats. While one person is sampling, a second person should stand outside the sampling area, holding the bucket and spray bottle. After every few jabs, the sampler should hand the n et to the second person, who then can rinse the contents of the net into the bucket.
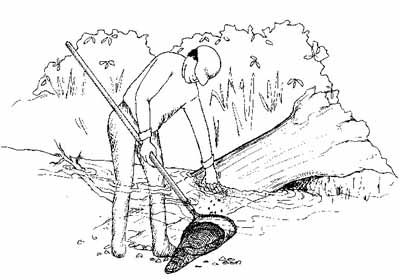 Figure 4.18 Collecting a sample from a log Volunteer rubs the log with one hand and catches dislodged organisms and other material in the net. |
Use care when pouring so that organisms are not lost over the side of the net. Use your spray bottle, forceps, sugar scoop, and gloved hands to remove all the material from bucket #1 onto the net. When you are satisfied that bucket #1 is empty, use your h ands and the sugar scoop to transfer all the material from the net into the empty jar. You can also try to carefully empty the contents of the net directly into the jar by turning the net inside out into the jar.
Bucket #2 captured the water and any organisms that might have fallen through the netting. As a final check, repeat the process above, but this time, pour bucket #2 over the net, into bucket #1. Transfer any organisms on the net into the jar.
|
Station #: __________________________ Stream: _____________________________ Location: ___________________________ Date/Time: __________________________
Team members: _____________________________________ _____________________________________ |
Figure 4.19 Example of a Station ID tag To prevent samples from being mixed up, volunteers should place the ID tag inside the sample jar. |
| Muddy-Bottom Streams Part2: Habitat Assessment |
You will conduct a habitat assessment (which will include measuring general characteristics and local land use) in a 100-yard section of the stream that includes the habitat areas from which organisms were collected.
Many of the attachment sites result from debris falling into the stream from the surrounding vegetation. When debris first falls into the water, it is termed new fall and it has not yet been "broken down" by microbes (conditioned) for macroinvertebrate co lonization. Leaf material or debris that is conditioned is called old fall. Leaves that have been in the stream for some time lose their color, turn brown or dull yellow, become soft and supple with age, and might be slimy to the touch. Woody debris becom es blackened or dark in color; smooth bark becomes coarse and partially disintegrated, creating holes and crevices. It might also be slimy to the touch.
|
A reference collection is a sample of locally-found macroinvertebrates that have been identified, labelled, and preserved in alcohol. The program advisor, along with a professional biologist/entomologist, should assemble the reference collection, properly identify all samples, preserve them in vials, and label them. This collection may then be used as a training tool and, in the field, as an aid in macroinvertebrate identification. |
Before you leave the stream location, make sure that all your equipment has been collected and rinsed properly. Double-check to see that sample jars are tightly closed and properly identified. All samples, field sheets, and equipment should be returned to the coordinator at this point. You might want to keep a copy of the field data sheet for comparison with future monitoring trips and for personal records.
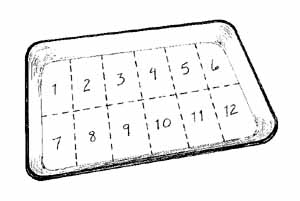 Figure 4.20 A Gridded subsampling pan Volunteers collect a subsampling of organisms by picking them from randomly selected grid squares. |
| Session 1: | Picking a subsample of aquatic organisms |
When you think all the organisms have been transferred from the plate or tray to the subsample vial, have a second volunteer check to confirm that all organisms have been removed. On your lab sheet, record how many organisms are in the subsample.
If, after picking the entire gridded pan clean, you have fewer than 100 organisms, and your reference site produced 100 or more organisms, either your site is impaired or your sampling technique is flawed. It is also possible that recent heavy rains migh t have washed many organisms downstream. If you do not find 100 organisms in the entire sample, be sure to note the potential cause for such a problem on the Habitat Assessment Data Sheet.
|
Station #: __________________________ Stream: _____________________________ Location: ___________________________ Date/Time: __________________________
Subsample team members: _____________________________________ _____________________________________ |
Figure 4.21 Example of a Subsample ID tag To prevent wubsamples from being mixed up, volunteers should place the ID tag inside the subsample jar. |
| Session 2: | Identifying the subsample to family level |
|
Maintaining a voucher collection adds another layer of credibility to the program by documenting the accuracy of the volunteer identifications. It substantiates and provides evidence to support the analysis of the data�a powerful quality control element. However, an important issue to consider is how long to keep the samples. Program managers, in collaboration with technical advisors, will have to consider the following in keeping a voucher collection.
|
Your program's consulting biologist should work in cooperation with the state agency to identify the reference condition(s) you will need to conduct an Intensive Stream Biosurvey. The biologist will use the reference condition to establish a water quality rating system against which to rank your monitored stream sites.
To perform the habitat assessment data analysis for the Intensive Stream Biosurvey, perform the following tasks.
| % Similarity to Reference Score | Habitat Quality Category | Attributes | Table 4.5 Reference scores for sampling site comparison If a score falls at or near the break between categories, use your best judgement to determine the appropriate score. |
| >90% | Excellent | Commparable to the best situation to be expected within an ecoregion. Excellent overall habitat structure conducive to supporting healthy biological community. | |
| 75-88% | Good | Habitat structure slightly impaired. Generally, diverse instream habitat well-developed; some degradation of riparian zone and banks; a small amount of channel alteration may be present. | |
| 60-73% | Fair | Loss of habitat compared to reference. Habitat is a major limiting factor to supporting a healthy biological community. | |
| <58% | Poor | Severe habitat alteration at all levels. |
The Intensive Stream Biosurvey recommends the use of four basic metrics (taxa richness, number of EPT taxa, percent abundance of EPT, and sensitive taxa index) plus two optional metrics (percent abundance of scrapers and percent abundance of shredders). T hese metrics are discussed briefly below. Refer to the reference list for more information.
The term taxa (plural for taxon), used below, refers to the specific taxonomic groupings to which organisms have been identified. For the Intensive Stream Biosurvey, organisms are identified to the taxon of family. Your volunteer monitoring program should identify organisms to a specific taxonomic grouping if it is to compare results over time and between sites. The following metrics are generally applicable throughout the country (but confirm this with a local biologist).
| Sensitive taxa index = | E(Xit)/n |
Xi = the number of individuals in each taxon
t = tolerance value for each taxon in the sample
n = number of individuals in the sample
Macroinvertebrates that "scrape" or graze on these algae are known as scrapers. To compute the percent abundance of the scrapers in the macroinvertebrate community, divide the number of organisms classified as grazers or scrapers by the total number of organisms in the sample. A high percent abundance of scrapers is good.
The following optional metrics can be used in muddy-bottom streams as additional metrics to provide more information about the condition of the macroinvertebrate assemblage.
To calculate a score for your stream site using one of these worksheets, enter the metric values at the monitored site in the (M) column. Compare each metric value from your monitored site to the value ranges presented in the biosurvey score columns. Choo se the matching range and circle it; this gives you the corresponding score (6, 3, or 0) for your metric value. Add the metric scores to obtain the total biosurvey score (see instructions in Tables 4.6 and 4.7).
Brigham, A. R., W. U. Brigham, and A. Gnilka. 1982. Aquatic Insects and Oligochaetes of North and South Carolina. Midwest Enterprises, Mahomet, IL. (k)
Cummins, Kenneth W. and Margaret A. Wilzbach. 1985. Field Procedures for Analysis of Functional Feeding Groups of Stream Macroinvertebrates. University of Maryland, Frostburg. (k)
Dates, G. and J. Byrne. 1995. River Watch Network Benthic Macroinvertebrate Monitoring Manual. River Watch Network. 153 State St., Montpelier, VT 05602 ($25). (k)
Delaware Nature Education Center. 1996. Delaware Stream Watch Guide. Delaware Nature Society, P.O. Box 700, Hockessin, DE 19707.
Fore, L., J. Karr, and R. Wiseman. 1996. Assessing Invertebrate Responses to Human Activities: Evaluating Alternative Approaches. Journal of the North American Benthological Society. 15(2):212-231.
Hilsenhoff, William L. 1982. Using a Biotic Index to Evaluate Water Quality in Streams. Wisconsin Department of Natural Resources, Madison, WI. Technical Bulletin No. 132.
Hilsenhoff, William L. 1988. Rapid Field Assessment of Organic Pollution With a Family-level Biotic Index. Journal of the North American Benthological Society, 7:65-68.
Izaak Walton League of America (IWLA). 1992. A Monitor's Guide to Aquatic Macroinvertebrates. Izaak Walton League of America Save Our Streams. 707 Conservation Lane, Gaithersburg, MD 20878. (k)
Izaak Walton League of America (IWLA). Stream Insects and Crustaceans Card. Izaak Walton League of America Save Our Streams. 707 Conservation Lane, Gaithersburg, MD 20878. (k)
Karr, J. R. In press. Rivers As Sentinels: Using the Biology of Rivers to Guide Landscape Management. In The Ecology and Management of Streams and Rivers in the Pacific Northwest Coastal Ecoregion. Springer-Verlag, NY
Klemm, D.J., et al. 1990. Macroinvertebrate Field and Laboratory Methods for Evaluating the Biological Integrity of Surface Waters. EPA/600/4-90/030. U.S. Environmental Protection Agency, Office of Research and Development, Cincinnati, OH.
Lathrop, J. 1989. A Naturalist's Key to Stream Macroinvertebrates for Citizen Monitoring Programs in the Midwest. In Proceedings of the 1989 Midwest Pollution Control Biologists Meeting, Chicago IL, EPA 9059-89/007, ed. W.S. Davis and T.P. Simon, U SEPA Region 5 Instream Biocriteria and Ecological Assessment Committee. Chicago, Illinois. (k)
Maryland Save Our Streams. 1994. Project Heartbeat Volunteer Monitoring Handbook. Maryland Save Our Streams, 258 Scotts Manor Dr., Glen Burnie, MD 21061.
McCafferty, W. P. 1981. Aquatic Entomology: The Fishermen's and Ecologists' Illustrated Guide to Insects and Their Relatives. Science Books International, Boston. (k)
McDonald, B., W. Borden, and J. Lathrop. Citizen Stream Monitoring: A Manual for Illinois. ILENR/RE-WR90/18. Illinois Department of Energy and Natural Resources.
Merritt, R. W. and K. W. Cummins, eds. 1984. An Introduction to the Aquatic Insects of North America. 2nd. ed. Kendall/Hunt Publishing Company, Dubuque. (k)
Moen, C. and J. Schoen. 1994. Habitat Monitoring. The Volunteer Monitor 6(2):1
Needham, James C. and Paul R. Needham. 1988. A Guide to the Study of Fresh-Water Biology. Reiter's Scientific and Professional Books, Washington, D.C. (k)
Peckarsky, Barbara L. et al., 1990. Freshwater Macroinvertebrates of Northeastern North America. Cornell University Press, Ithaca, New York. (k)
Pennak, Robert W. 1989. Fresh-Water Invertebrates of the United States: Protoza to Mollusca. 3rd. ed. John Wiley and Sons, New York. (k)
Plafkin, J.L., M.T. Barbour, K.D. Porter. S.K. Gross, and R.M. Hughes. 1989. Rapid Bioassessment Protocols for Use in Streams and Rivers: Benthic Macroinvertebrates and Fish. EPA 440/4-89-001. U.S. Environmental Protection Agency, Office of Wetland s, Oceans, and Watersheds, 4503F, Washington, DC 20460.
River Watch Network. 1992. A Simple Picture Key: Major Groups of Benthic Macroinvertebrates Commonly Found in Freshwater New England Streams. River Watch Network, 153 State St., Montpelier, VT 05602 (k)
Tennessee Valley Authority (TVA). 1994. Common Aquatic Flora and Fauna of the Tennessee Valley. Water Quality Series Booklet 4. TVA, Chattanooga, TN. (k)
Tennessee Valley Authority (TVA). 1988. Homemade Sampling Equipment. Water Quality Series Booklet 2. TVA, Chattanooga, TN.
Thorp, J.H. and A.P. Covich, eds. 1991. Ecology and Classification of North American Freshwater Invertebrates. Academic Press, NY. (Especially Chapter 17 by W.L. Hilsenhoff) (k)
USEPA. 1992. Streamwalk Manual. March. U.S. Environmental Protection Agency Region 10, Water Management Division, Seattle, WA.
USEPA. 1994. Biological Criteria: Technical Guidance for Small Streams and Rivers. EPA 822-B-94-001. U.S. Environmental Protection Agency, Office of Wetlands, Oceans, and Watersheds, 4503F, Washington, DC 20460.
USEPA. 1996. The Volunteer Monitor's Guide to Quality Assurance Project Plans. EPA 841-B-96-003. U.S. Environmental Protection Agency, Office of Wetlands, Oceans, and Watersheds, 4503F, Washington, DC 20460.
Intensive Biosurvey: Macroinvertebrate Assessment (PDF, 90.5 KB)
Intensive Biosurvey: Habitat Assessment (PDF, 80.8)
Adobe Acrobat Reader is required to view PDF documents. The most recent version of the Adobe Acrobat Reader is available as a free download. An Adobe Acrobat plug-in for assisted technologies is also available.
EPA Home | Office of Water | Search | Comments
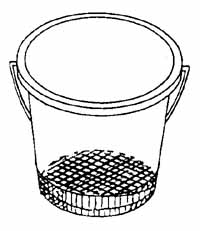 Most professional biological monitoring programs employ sieve buckets as a holding container for composited samples. These buckets have a mesh bottom that allows water to drain out while the organisms and debris remain. This material can then be easily transferred to the alcohol-filled jars. However, sieve buckets can be expensive. Many volunteer programs employ alternative equipment, such as the two regular buckets described in this section. Regardless of the equipment, the process for compositing and transferring the sample is basically the same. The decision is one of cost and convenience.