4.2
Streamside Biosurvey
The Streamside Biosurvey is based on the simple macroinvertebrate sampling approach developed and used by the Ohio Department of Natural Resources and the Izaak Walton League of America's Save Our Streams program and adapted by many volunteer monitoring programs throughout the United States.
This assessment approach has two basic components. The first is a biosurvey of aquatic organisms that involves collecting and identifying macroinvertebrates in the field and calculating an index of stream quality. The second is the habitat characterization method known as the Streamside Biosurvey Habitat Walk.
Two methods of macroinvertebrate sampling are detailed in this section one for rocky-bottom streams (using a kick net) and one for muddy-bottom streams (using a dip net). Figure 4.7 illustrates and describes the nets used for these assessments. Both of these aquatic organism collection procedures have been widely tested and used successfully by many groups. You should consult with a local aquatic scientist to determine which method is appropriate for streams in your area.
|
Note
The Streamside Biosurvey is based on protocols developed and widely used by programs such as the Ohio Department of Natural Resources, the Izaak Walton League of America, and others. This manual recommends some modifications to their established protocols. These include:
- A finer mesh size for the kick and dip nets used to sample for macroinvertebrates
- In rocky-bottom streams, compositing three samples into one before identifying macroinvertebrates rather than identifying macroinvertebrates in three separate samples and choosing the best result. Compositing generally provides a more representative sample of the macroinvertebrate community than a discrete sample taken from one part of the riffle. Riffle areas have what is known as a patchy distribution of organisms, meaning that different types of organisms are naturally found in different parts of the riffle. In order to more accurately assess the macroinvertebrate community in a rocky-bottom stream site, it is important to take a representative sample that includes organisms found in different microhabitats—such as in different parts of the riffle or in riffles of various flows and depths.
- A new method for calculating the stream quality rating. This modification incorporates a weighting factor to take into account the abundance of organisms in each pollution tolerance category (pollution-sensitive, somewhat tolerant, and tolerant).
- In muddy-bottom streams, varying how much each habitat type is sampled depending on its abundance at the sampling site.
|
Like the Stream Habitat Walk described in Section 4.1, the Streamside Biosurvey is useful as a screening tool to identify water quality problems and as an educational tool to teach volunteers about pollution and stream ecology. But instead of randomly picking up rocks or sticks and brushing off macroinvertebrates for simple observation purposes, Streamside Bio-survey volunteers are trained to use special nets and standardized sampling protocols to collect organisms from a measured area of stream habitat. Volunteers identify collected organisms, usually to the order level, and sort them into taxonomic groups based on their ability to tolerate pollution. Using this information, volunteers can then calculate a simple stream quality rating of good, fair, or poor.
Because the Streamside Biosurvey involves a standardized sampling protocol, a basic level of training, professional assistance, and a simple stream rating based on macroinvertebrate diversity and abundance, this approach is more effective than the Stream Habitat Walk in characterizing stream health and determining general water quality trends over several years. However, this method is not generally suited to determining subtle pollution impacts due, in part, to its uncomplicated level of macroinvertebrate identification and analysis. This, of course, is also one of the Streamside Biosurvey's greatest strengths, since volunteers can be easily trained in its methods.
Key features of the Streamside Biosurvey are as follows:
- It includes the Streamside Biosurvey Habitat Walk as its physical habitat characterization and visual biological characterization components. This protocol is a somewhat more detailed version of the Stream Habitat Walk described in Section 4.1.
- It centers around a macroinvertebrate survey in which organisms are collected according to specific protocols, identified in the field (generally to taxonomic order), and are then released back into the stream.
- For the identification process, volunteers group macroinvertebrates into three categories based on their pollution tolerance or sensitivity. Volunteers then calculate a water quality index by counting the specimens in each sensitivity category and determining whether they are rare, common, or dominant; multiplying the number of taxa in each category by a weighting factor; adding all the scores; and comparing results to a water quality rating scale that has been determined by a locally knowledgeable biologist/ecologist.
- The Streamside Biosurvey requires some equipment and training. Training can be conducted at the stream site, although some advance preparation is required. For example, a biologist with regional experience should assist in developing the macroinvertebrate key and the tolerance category groupings on the field data sheets. A reference collection is recommended to help volunteers identify macroinvertebrates.
Step 1 Prepare for the Streamside Biosurvey field work
Much of the preparation work for this approach is similar to that of the Stream Habitat Walk (section 4.1). Refer back to that section for relevant information on the following tasks:
- Scheduling the biosurvey
- Obtaining a USGS topographical map
- Selecting and marking monitoring locations
- Becoming familiar with safety procedures
TASK 1 Gather tools and equipment for the Streamside Biosurvey
In addition to the basic equipment listed in Section 2.4, you should collect the following equipment needed for the macroinvertebrate collection of the Streamside Biosurvey:
- Vial with tight cap filled about one-half full with 70 percent ethyl alcohol
- Buckets (2)
- Hand lens, magnifying glass, or field microscope
- Tweezers, eyedropper, or spoon
- Plastic bag
- Large, shallow, white pans, such as dishpans (2)
- Spray water bottle
- Plastic ice cube tray
- Taxonomic key to aquatic organisms
- Calculator
- For rocky-bottom streams--Kick net, a fine mesh (500 µm) nylon net approximately 3x3 feet with a 3-foot long supporting pole on each side is recommended--Figure 4.7).
- For muddy-bottom streams--D-frame net (a dip net with a frame 12 inches wide with a fine nylon mesh, usually about 500 µm, attached to the frame).
Step 2 Collect and Sort Macroinvertebrates
The method you use to collect macroinvertebrates using this approach depends on the type of stream you are sampling. Rocky-bottom streams are defined as those with bottoms made up of gravel, cobbles, and boulders in any combination and usually have definite riffle areas. Riffle areas are fairly well oxygenated and, therefore, are prime habitats for benthic macroinvertebrates. In these streams, use the rocky-bottom sampling method.
Muddy-bottom streams have muddy, silty, or sandy bottoms and lack riffles. Generally, these are slow moving, low-gradient streams (i.e., streams that flow along relatively flat terrain). In such streams, macroinvertebrates generally attach themselves to overhanging plants, roots, logs, submerged vegetation, and stream substrate where organic particles are trapped. In these streams, use the muddy-bottom sampling method.
Both methods are detailed below. Regardless of which collection method is used, the process for counting, identifying, and analyzing the macroinvertebrate sample for the Streamside Biosurvey is the same.
| Rocky-Bottom Sampling Method |
Use the following method of macroinvertebrate sampling in streams that have riffles and gravel/cobble substrates. You will collect three samples at each site and composite (combine) them to obtain one large total sample.
TASK 1 Identify the sampling location
You should have already located your site on a map along with its latitude and longitude (see Task 3, in Section 4.1 - Stream Habitat Walk).
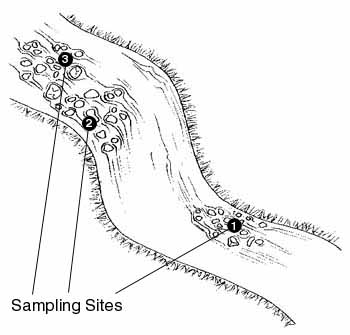
Figure 4.8
Location of sample sites in a rocky-bottom stream with riffles
Within a 100 yard reach volunteers begin their sampling at the most downstream site and then work their way upstream.
|
- You are going to sample in three different spots within a 100-yard stream reach. These spots may be three separate riffles; one large riffle with different current velocities; or, if no riffles are present, three run areas with gravel or cobble substrate. Combinations are also possible (if, for example, your site has only one small riffle and several run areas).
Mark off your 100-yard stream reach. If possible, it should begin at least 50 yards upstream of any human-made modification of the channel, such as a bridge, dam, or pipeline crossing, Avoid walking in the stream, since this might dislodge macroinvertebrates and alter your sampling results.
- Sketch the 100-yard sampling area. Indicate the location of your three sampling spots on the sketch. Mark the most downstream site as Site 1, the middle site as Site 2, and the upstream site as Site 3. (See Fig. 4.8.)
TASK 2 Get into place
- Always approach your sampling locations from the downstream end and sample the site farthest downstream first (Site 1) (see Fig. 4.9, Panel #1). This minimizes the possibility of biasing your second and third collections with dislodged sediment or macroinvertebrates.
Always use a clean kick net, relatively free of mud and debris from previous uses. Fill a bucket about one third full with stream water and fill your spray bottle.
- Select a 3-foot by 3-foot riffle area for sampling at Site 1. One member of the team, the net holder, should position the net at the downstream end of this sampling area. Hold the net handles at a 45 degree angle to the water's surface (see Fig. 4.9, Panel #2). Be sure that the bottom of the net fits tightly against the stream-bed so no macroinvertebrates escape under the net. You may use rocks from the sampling area to anchor the net against the stream bottom. Don't allow any water to flow over the net.
TASK 3 Dislodge the macroinvertebrates
- Pick up any large rocks in the 3-foot by 3-foot sampling area and rub them thoroughly over the partially-filled bucket so that any macroinvertebrates clinging to the rocks will be dislodged into the bucket (see Fig. 4.9, Panel #3). Then place each cleaned rock outside of the sampling area. After sampling is completed, rocks can be returned to the stretch of stream they came from.
- The member of the team designated as the "kicker" should thoroughly stir up the sampling area with their feet, starting at the upstream edge of the 3-foot by 3-foot sampling area and working downstream, moving toward the net. All dislodged organisms will be carried by the stream flow into the net (see Fig. 4.9, Panel #4). Be sure to disturb the first few inches of stream sediment to dislodge burrowing organisms. As a guide, disturb the sampling area for about 3 minutes, or until the area is thoroughly worked over.
- Any large rocks used to anchor the net should be thoroughly rubbed into the bucket as above.
TASK 4 Remove the net
- Next, remove the net without allowing any of the organisms it contains to wash away. While the net holder grabs the top of the net handles, the kicker grabs the bottom of the net handles and the net's bottom edge. Remove the net from the stream with a forward scooping motion (see Fig. 4.9, Panel #5).
- Roll the kick net into a cylinder shape and place it vertically in the partially filled bucket. Pour or spray water down the net to flush its contents into the bucket (see Fig. 4.9, Panel #6). If necessary, pick debris and organisms from the net by hand. Release back into the stream any fish, amphibians, or reptiles caught in the net.
TASK 5 Collect the second and third samples
Once you have removed all the organisms from the net repeat these tasks at Sites 2 and 3. Put the samples from all three sites into the same bucket. Combining the debris and organisms from all three sites into the same bucket is called compositing.
Hint: If your bucket is nearly full of water after you have washed the net clean, let the debris and organisms settle to the bottom of the bucket. Then cup the net over the bucket and pour the water through the net into a second bucket. Inspect the water in the second bucket to be sure no organisms came through.
TASK 6 Sort macroinvertebrates
Pour the contents of the bucket into a large, shallow, white pan. Add some stream water to the pan, and fill the ice cube tray with stream water. Using tweezers, eye dropper, or spoon, pick through the leaf litter and organic material looking for anything that swims, crawls, or seems to be hiding in a shell, like a snail. Look carefully; many of these creatures are quite small and fast-swimming. Sort similar organisms into the ice cube tray.
Note: Instructions for counting, identifying, and
analyzing the macroinvertebrate sample follow the muddy-bottom sampling
method. (See Step 3)
| Muddy-Bottom Sampling Method |
|
Picking Bugs
Some monitoring programs find it easier to collect organisms from the net by hand-picking them rather than washing the sample into a pan and then trying to pick through the floating debris. The advantage to placing the organisms in a pan is that they are more likely to survive while in the pan and their characteristic movements will help in organism identification.
If you prefer to pick bugs directly off the net, a white background, such as a white plastic trash bag under the net, will help you see the bugs more clearly. In addition, periodically wetting the net with a water bottle will help keep the bugs alive and moving.
Identification can be made easier if you sort the organisms into groups based on physical similarities and place them together in sections of an ice cube tray as you pick them from the pan or net.
|
In muddy-bottom streams, as in rocky- bottom streams, the goal is to sample the most productive habitats available and look for the widest variety of organisms. The most productive habitats are the ones that harbor a diverse population of pollution sensitive-macroinvertebrates. Volunteers should sample by using a D-frame net to jab at the habitat and scoop up the organisms that are dislodged. The objective is to collect a combined sample from 20 jabs taken from a variety of habitats.
TASK 1 Determine which habitats are present
Muddy-bottom streams usually have four habitats (Fig. 4.10). It is generally best to concentrate sampling efforts on the most productive habitat available, yet to sample other principal habitats if they are present. This ensures that you will secure as wide a variety of organisms as possible. Not all habitats are present in all streams or present in significant amounts. If your sampling areas have not been preselected, try to determine which of the following habitats are present. (Avoid standing in the stream while making your habitat determinations.)
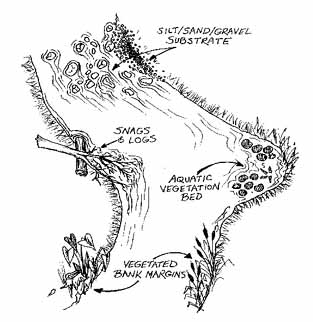
Figure 4.10
Four habitats found in muddy-bottom streams
Volunteers will likely find the most macroinvertebrates in vegetated habitats and snags and logs.
|
- Vegetated bank margins. This habitat consists of overhanging bank vegetation and submerged root mats attached to banks. The bank margins may also contain submerged, decomposing leaf packs trapped in root wads or lining the streambanks. This is generally a highly productive habitat in a muddy_bottom stream, and it is often the most abundant type of habitat.
- Snags and logs. This habitat consists of submerged wood, primarily dead trees, logs, branches, roots, cypress knees and leaf packs lodged between rocks or logs. This is also a very productive muddy-bottom stream habitat.
- Aquatic vegetation beds and decaying organic matter. This habitat consists of beds of submerged, green/leafy plants that are attached to the stream bottom. This habitat can be as productive as vegetated bank margins, and snags and logs.
- Silt/sand/gravel substrate. This habitat includes sandy, silty, or muddy stream bottoms; rocks along the stream bottom; and/or wetted gravel bars. This habitat may also contains algae-covered rocks (sometimes called Aufwuchs). This is the least productive of the four muddy-bottom stream habitats, and it is always present in one form or another (e.g., silt, sand, mud, or gravel might predominate).
TASK 2 Determine how many times to jab in each habitat type
Your goal is to jab a total of 20 times. The D-frame net is 1 foot wide, and a jab should be approximately 1 foot in length. Thus, 20 jabs equals 20 square feet of combined habitat.
- If all four habitats are present in plentiful amounts, jab the vegetated banks 10 times and divide the remaining 10 jabs among the remaining 3 habitats.
- If three habitats are present in plentiful amounts and one is absent, jab the silt/sand/gravel substrate the least productive habitat 5 times and divide the remaining 15 jabs among the other two more productive habitats.
- If only two habitats are present in plentiful amounts, the silt/sand/gravel substrate will most likely be one of those habitats. Jab the silt/sand/gravel substrate 5 times and the more productive habitat 15 times.
- If some habitats are plentiful and others are sparse, sample the sparse habitats to the extent possible, even if you can take only one or two jabs. Take the remaining jabs from the plentiful habitat(s). This rule also applies if you cannot reach a habitat because of unsafe stream conditions. Jab a total of 20 times.
Because you might need to make an educated guess to decide how many jabs to take in each habitat type, it is critical that you note, on the field data sheet, how many jabs you took in each habitat. This information can be used to help characterize your findings.
TASK 3 Get into place
Outside and downstream of your first sampling location (1st habitat), rinse the dip net and check to make sure it does not contain any macroinvertebrates or debris from the last time it was used. Fill a bucket approximately one-third full with clean stream water. Also, fill the spray bottle with clean stream water. This bottle will be used to wash down the net between jabs and after sampling is completed.
This method of sampling requires only one person to disturb the stream habitats. While one person is sampling, a second person should stand outside the sampling area, holding the bucket and spray bottle. After every few jabs, the sampler should hand the net to the second person, who then can rinse the contents of the net into the bucket.
TASK 4 Dislodge the macroinvertebrates
Approach the first sample site from downstream, and sample as you walk upstream. Here is how to sample in the four habitat types:
- Sample vegetated bank margins by jabbing vigorously, with an upward motion, brushing the net against vegetation and roots along the bank. The entire jab motion should occur underwater.
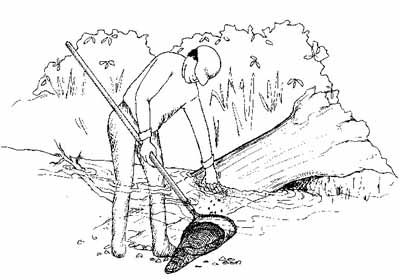
Figure 4.11
Collecting a sample from a log
Volunteer rubs the log with one hand and catches dislodged organisms and other material in the net.
|
- To sample snags and logs, hold the net with one hand under the section of submerged wood you are sampling. With the other hand (which should be gloved), rub about 1 square foot of area on the snag or log. Scoop organisms, bark, twigs, or other organic matter you dislodge into your net. Each combination of log rubbing and net scooping is one jab (Fig. 4.11).
- To sample aquatic vegetation beds, jab vigorously, with an upward motion, against or through the plant bed. The entire jab motion should occur underwater.
- To sample a silt/sand/gravel substrate, place the net with one edge against the stream bottom and push it forward about a foot (in an upstream direction) to dislodge the first few inches of silt, sand, gravel, or rocks. To avoid gathering a netful of mud, periodically sweep the mesh bottom of the net back and forth in the water, making sure that water does not run over the top of the net. This will allow fine silt to rinse out of the net.
When you have completed all 20 jabs, rinse the net thoroughly into the bucket. If necessary, pick any clinging organisms from the net by hand and put them in the bucket.
TASK 5 Sort the macroinvertebrates
Pour the contents of the bucket (water, organisms, and organic material) into a large, shallow, white pan and fill the ice cube tray with clean stream water. Using tweezers, eye dropper, or spoon, pick through the leaf litter and organic material looking for anything that swims, crawls, or seems to be hiding in a shell (like a snail). Look carefully; many of these creatures are quite small and fast-swimming. Sort similar organisms into the plastic ice cube tray.
Step 3 Identify Macroinverte-brates and Calculate Stream Rating
The following methods are used for both the rocky- and muddy-bottom assessments.
Task 1 Identify Macroinvertebrates
- Identify the collected macroinvertebrates. Using the hand lens or magnifying glass and the aquatic organism identification key, carefully observe the collected macroinvertebrates. Refine your initial sort so that like individuals are placed in the same section(s) of the ice cube tray. If you cannot identify an organism, place one or two specimens in the alcohol-filled vial and forward it to your program coordinator for identification.
- On your field data sheet, note the number of individuals of each type of organism you have identified (Section 3 of the field data sheet See Fig. 4.12.).
Note: When you feel that you have identified all the organisms to the best of your ability, return the macroinvertebrates to the stream.
- Assign one of the following abundance codes to each type of organism. Record the code next to the actual count on the field data sheet.
| R (rare) | = | if 1-9 organisms are found in the sample |
| C (common) | = | if 10-99 organisms are found in the sample |
| D (dominant) | = | if 100 or more organisms are found in the sample |
Your field data sheet should be organized to help you sort macroinvertebrates into three groups based on their ability to tolerate pollution. A local authority (such as a state biologist or entomologist) should determine which organisms belong in each pollution tolerance category for your region.
Generally, the three tolerance groups are as follows:
- Group I (sensitive organisms) includes pollution- sensitive organisms such as mayflies, stoneflies, and non net-spinning caddisflies, which are typically found in good-quality water.
- Group II (somewhat sensitive organisms) includes somewhat pollution-tolerant organisms such as net-spinning caddisflies, crayfish, sowbugs, and clams, found in fair-quality water.
- Group III (tolerant organisms) includes pollution-tolerant organisms such as worms, leeches, and midges, found in poor-quality water.
TASK 2 Calculate the stream quality rating
The stream water quality rating takes into account the pollution sensitivity of the organisms and their relative abundance. This is accomplished through use of a weighting system.
The weighting system acknowledges the most desirable combinations of pollution sensitivity and abundance by assigning these extra weights within a 5, 3, and 1 point scale. Pollution-sensitive organisms receive a weighting factor based on a 5-point scale.
Somewhat sensitive organisms are weighted on a 3-point scale, and tolerant organisms are weighted on a 1-point scale. As can be seen in Table 4.2, a sample's ideal combination of organisms would be "sensitive" and "somewhat sensitive" organisms in common
abundance (10-99 organisms), and pollution "tolerant" organisms in rare abundance (less than 10 organisms). This is because it is never ideal for any given type of organism to dominate a sample, and because it is best to have a wide variety of organisms including a few pollution-tolerant individuals.
- Add the number of R's, C's and D's in each of the 3 pollution tolerance groupings. Then, for each grouping, multiply the total number of R's, C's and D's by the relevant weighting factor. Table 4.3 illustrates sample calculations for determining the water quality rating for (hypothetical) Volunteer Creek.
Note: The tolerance category groupings shown on the Biosurvey Data Sheet were developed for streams in the mid-Atlantic (Maryland, Virginia, West Virginia, District of Columbia, Pennsylvania). These groupings may not totally apply in other regions
of the United States. It is important that a local aquatic biologist take a look at these categories and make any changes necessary for your region.
In addition, depending on the level of taxonomic training volunteers receive, you might consider separating out some other families of organisms. For instance, the tolerance groupings given here separate caddisflies into net-spinning and non net-spinning
families. Mayflies might also be separated into different tolerance groupings. It is not recommended here, however, because of the difficulty in distinguishing mayfly families in the field without a microscope.
Some volunteer programs, like the one coordinated by the Audubon Naturalist Society in Maryland, conduct intensive field identification training workshops and teach volunteers to distinguish several families in the field. Creating more specific tolerance
groupings may be an option for your program if you have the resources and expertise to conduct more intensive taxonomic field training.
- To obtain a water quality rating for the site, total the values for each group and add them together. The total score for the sample stream site is: 16.2 (Group I) + 19.0 (Group II) + 2.3 (Group III) = 37.5.
- The final step is to compare the score to water quality ratings (good to poor) established by a trained biologist familiar with local stream fauna. Table 4.4 presents a tentative rating scale for streams in Maryland. Assuming Volunteer Creek is located in Maryland, the stream would receive a rating of "Fair."
Note: In addition to adjusting the rating scale according to regional location, it might also need to be adjusted for muddy-bottom vs. rocky-bottom streams. An experienced stream biologist can calculate the best rating system for your area's streams by examining data from several streams.
| Abundance |
Weighting Factor |
Table 4.2
Weighting factors used in calculating stream water quality ratings |
| |
Group I
Sensitive |
Group II
Somewhat Sensitive |
Group III
Tolerant |
| Rare (R) |
5.0 |
3.2 |
1.2 |
| Common (C) |
5.6 |
3.4 |
1.1 |
| Dominant (D) |
5.3 |
3.0 |
1.0 |
Group I
Sensitive |
Group II
Somewhat Sensitive |
Tolerant |
Table 4.3
Sample calculations of index values for Volunteer Creek |
| 1 (No. of R's) x 5.0 = 5.0
2 (No. of C's) x 5.6 = 11.2 |
3 (No. of R's) x 3.2 = 9.6
1 (No. of C's) x 3.4 = 3.4
2 (No. of D's) x 3.0 = 6.0 |
1 (No. of R's) x 1.2 = 1.2
1 (No of C's) x 1.1 = 1.1 |
| Index Value for Group I = 16.2 |
Index Value for Group II = 19.20 |
Index Value for Group III = 2.3 |
| Score |
Rating |
Table 4.4
Tentative rating scale for streams in Maryland |
| >40
20-40
<20 |
Good
Fair
Poor |
In a healthy stream, the sensitive (Group I) organisms will be well represented in a sample. It is important to remember that macroinvertebrate populations can fluctuate seasonally and that these natural fluctuations can affect your results. Therefore, it
is best to compare the results by season from year to year. (Compare your spring sampling results to each other, not to fall results.)
Step 4 Conduct the Streamside Biosurvey: Habitat Walk
You will conduct a habitat assessment (which will include measuring general characteristics and local land use) in a 100-yard section of stream that includes the riffles from which organisms were collected.
TASK 1 Delineate the habitat assessment boundaries
- Begin by identifying the most downstream riffle that was sampled for macroinvertebrates. Using your tape measure or twine, mark off a 100-yard section extending 25 yards below the downstream riffle and about 75 yards upstream.
- Complete the identifying information on your field data sheet for your habitat assessment site. On your stream sketch, be as detailed as possible, and be sure to note which riffles were sampled.
TASK 2 Complete the Physical Characteristics, Local Watershed Characteristics, and Visual Biological Survey sections of the field sheet
For safety reasons as well as to protect the stream habitat, it is best to estimate these characteristics rather than actually wading into the stream to measure them.
In-stream Characteristics
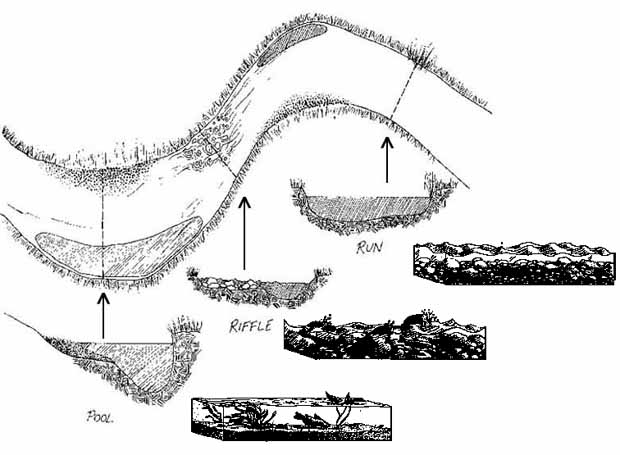
Figure 4.13
Overview and cross sections of a pool, riffle, and run
Varying flows and depths create a variety of habitats for macroinvertebrates.
|
- Pools, riffles, and runs create a mixture of flows and depths and provide a variety of habitats to support fish and invertebrate life. Pools are deep with slow water. Riffles are shallow with fast, turbulent water running over rocks. Runs are
deep with fast water and little or no turbulence.
- Stream bottom (substrate) is the material on the stream bottom. Identify what substrate types are present. Substrate types include:
- Silt/clay/mud--This substrate has a sticky, cohesive feeling. The particles are fine. The spaces between the particles hold a lot of water, making the sediments behave like ooze.
- Sand (up to 0.1 inch)--A sandy bottom is made up of tiny, gritty particles of rock that are smaller than gravel but coarser than silt (gritty, up to pea size).
- Gravel (0.1-2 inches)--A gravel bottom is made up of stones ranging from tiny quarter-inch pebbles to rocks of about 2 inches (fine gravel - pea size to marble size; coarse gravel - marble to tennis ball size).
- Cobbles (2-10 inches)--Most rocks on this type of stream bottom are between 2 and 10 inches (between a tennis ball and a basketball).
- Boulders (greater than 10 inches)--Most of the rocks on the bottom are greater than 10 inches (between a basketball and a car in size).
- Bedrock--is solid rock (or rocks bigger than a car).
Estimate the percentage of substrate types at your site.
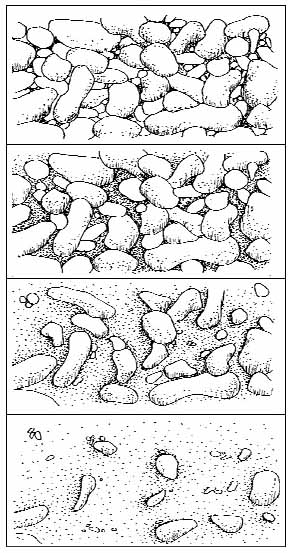
Figure 4.14
A representation of a rocky-bottom stream becoming embedded with sand and silt
As silt settles on the streambed, spaces between the rocks are filled in and the stream becomes more embedded.
|
- Embeddedness is the extent to which rocks (gravel, cobbles, and boulders) are sunken into the silt, sand, or mud of the stream bottom (Fig. 4.14). Generally, the more rocks are embedded, the less rock surface or space between rocks is available as habitat for aquatic macroinvertebrates and for fish spawning. Excessive silty runoff from erosion can increase the embeddedness in a stream. To estimate the embeddedness, observe the amount of silt or finer sediments overlying, in between, and surrounding the rocks.
- Streambed stability can provide additional clues to the amount of siltation in a stream. When you walk in the stream, note whether your feet sink significantly into sand or mud.
- Presence of logs or woody debris (not twigs and leaves) in stream can slow or divert water to provide important fish habitat such as pools and hiding places. Mark the box that describes the general amount of woody debris in the stream.
- Naturally occurring organic material in stream. This material includes leaves and twigs. Mark the box that describes the general amount of organic matter in the stream.
- Water appearance can be a physical indicator of water pollution.
- Clear - colorless, transparent
- Milky - cloudy-white or grey, not transparent; might be natural or due to pollution
- Foamy - might be natural or due to pollution, generally detergents or nutrients (foam that is several inches high and does not brush apart easily is generally due to some sort of pollution)
- Turbid - cloudy brown due to suspended silt or organic material
- Dark brown - might indicate that acids are being released into the stream due to decaying plants
- Oily sheen - multicolored reflection might indicate oil floating in the stream, although some sheens are natural
- Orange - might indicate acid drainage
- Green - might indicate excess nutrients being released into the stream
- Water odor can be a physical indicator of water pollution
- No smell or a natural odor
- Sewage - might indicate the release of human waste material
- Chlorine - might indicate over-chlorinated sewage treatment/water treatment plant or swimming pool discharges
- Fishy - might indicate the presence of excessive algal growth or dead fish
- Rotten eggs - might indicate sewage pollution (the presence of methane from anaerobic conditions)
- Water temperature can be particularly important for determining the suitability of the stream as aquatic habitat for some species of fish and macroinvertebrates that have distinct temperature requirements. Temperature also has a direct effect on the amount of dissolved oxygen available to the aquatic organisms. Measure temperature by submerging a thermometer for at least 2 minutes in a typical stream run. Repeat once and average the results.
Stream Bank and Channel Characteristics
- Depth of runs and pools should be determined by estimating the vertical distance from the surface to the stream bottom at a representative depth at each of the two habitats.
- The width of the stream channel can be determined by estimating the width of the streambed that is covered by water from bank to bank. If it varies widely, estimate an average width.
- Stream velocity can have a direct influence on the health, variety, and abundance of aquatic communities. If water flows too quickly, insects might be unable to maintain their hold on rocks and vegetation and be washed downstream; if water flows too slowly, it might provide insufficient aeration for species needing high levels of dissolved oxygen. Stream velocity can be affected by dams, channelization, terrain, runoff, and other factors. To measure stream velocity, mark off a 20-foot section of stream run and measure the time it takes a stick, leaf, or other floating biodegradable object to float the 20 feet. Repeat 5 times and pick the average time. Divide the distance (20 feet) by the average time (seconds) to determine the velocity in feet per second. (See Chapter 5, Section 1 on flow for a more in-depth discussion on using floats to estimate velocity.)
- The shape of the stream bank, the extent of artificial modifications, and the shape of the stream channel are determined by standing at the downstream end of the 25-yard section and looking upstream.
- The shape of the stream bank (Fig. 4.15) may include.
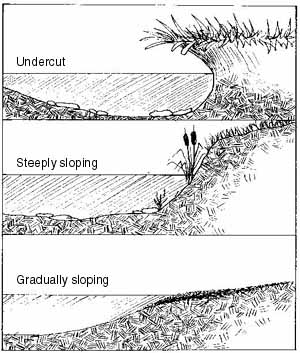
Figure 4.15
Types of streambank shapes
Undercut banks provide good cover for fish and macroinvertebrates.
|
- Vertical or undercut bank - a bank that rises vertically or overhangs the stream. This type of bank generally provides good cover for macroinvertebrates and fish and is resistant to erosion. However, if seriously undercut, it might be vulnerable to collapse.
- Steeply sloping - a bank that slopes at more than a 30 degree angle. This type of bank is very vulnerable to erosion.
- Gradual sloping - a bank that has a slope of 30 degrees or less. Although this type of stream bank is highly resistant to erosion, it does not provide much streamside cover.
- Artificial bank modifications include all structural changes to the stream bank such as riprap (broken rock, cobbles, or boulders placed on earth surfaces such as the face of a dam or the bank of a stream, for protection against the action
of the water) and bulkheads. Determine the approximate percentage of each bank (both the left and right) that is artificially covered by the placement of rocks, wood, or concrete.
- The shape of the stream channel can be described as narrow (less than 6 feet wide from bank to bank), wide (more than 6 feet from bank to bank), shallow (less than 3 feet deep from the stream substrate to the top of the banks) or deep (more
than 3 feet from the stream substrate to the top of the banks). Choose the category that best describes the channel.
- Narrow, deep
- Narrow, shallow
- Wide, deep
- Wide, shallow
- Streamside cover information helps determine the quality and extent of the stream's riparian zone. This information is important at the stream bank itself and for a distance away from the stream bank. For example, trees, bushes, and tall grass can contribute shade and cover for fish and wildlife and can provide the stream with needed organic material such as leaves and twigs. Lawns indicate that the stream's riparian zone has been altered, that pesticides and grass clippings are a possible problem, and that little habitat and shading are available. Bare soil and pavement might indicate problems with erosion and runoff. Looking upstream, provide an estimate of the percentage of the stream bank (left and right stream banks) covered by the following:
- Trees
- Bushes, shrubs - conifers or deciduous bushes less than 15 feet high
- Tall grass, ferns, etc. - includes tall natural grasses, ferns, vines, and mosses
- Lawn - cultivated and maintained short grass
- Boulders - rocks larger than 10 inches
- Gravel/cobbles/sand - rocks smaller than 10 inches; sand
- Bare soil
- Pavement, structure - any man-made structures or paved areas, including paths, roads, bridges, houses, etc.
- Stream shading is a measurement of the extent to which the stream itself is overhung and shaded by the cover identified in 14 above. This shade (or overhead canopy) provides several important functions in the stream habitat. It cools the water; offers habitat, protection, and refuge for aquatic organisms; and provides a direct source of beneficial organic matter and insects to the stream. Determine the extent that vegetation shades the stream at the site.
- General conditions of the stream bank and stream channel, and other conditions that might be affecting the stream are determined by standing at the downstream end of the 25-yard site and looking upstream. Provide observations for the right and left banks of the stream.
- Stream bank conditions that might be affecting the stream.
- Natural plant cover degraded--note whether streamside vegetation is trampled or missing or has been replaced by landscaping, cultivation, or pavement. (These conditions could lead to erosion.)
- Banks collapsed/eroded--note whether banks or parts of banks have been washed away or worn down. (These conditions could limit habitats in the area.)
- Garbage/junk adjacent to the stream--note the presence of litter, tires, appliances, car bodies, shopping carts, and garbage dumps.
- Foam or sheen on bank--note whether there is foam or an oily sheen on the stream bank. Sheen may indicate an oil spill or leak, and foam may indicate the presence of detergent.
- Stream channel conditions that might be affecting the stream.
- Mud/silt/sand on bottom/entering stream--can interfere with the ability of fish to sight potential prey. It can clog fish gills and smother fish eggs in spawning areas in the stream bottom. It can be an indication of poor construction practices, urban area runoff, silviculture (forestry-related activities), or agriculture in the watershed. It can also be a normal condition, especially in a slow-moving, muddy-bottom stream.
- Garbage or junk in stream--note the presence of litter, tires, appliances, car bodies, shopping carts, and garbage.
- Other general conditions that might be affecting the stream.
- Yard waste (e.g., grass clippings)--is there evidence that grass clippings, cut branches, and other types of yard waste have been dumped into the stream?
- Livestock in or with unrestricted access to stream--are livestock present, or is there an obvious path that livestock use to get to the water from adjacent fields? Is there streamside degradation caused by livestock?
- Actively discharging pipes are there pipes--with visible openings discharging fluids or water into the stream? Note such pipes even though you may not be able to tell where they come from or what they are discharging.
- Other pipes--are there pipes near or entering the stream? Note such pipes even if you cannot find an opening or see matter being discharged.
- Ditches--are there ditches, draining the surrounding land and leading into the stream?
Local watershed characteristics
- Adjacent land uses can potentially have a great impact on the quality and state of the stream and riparian areas. Determine the land uses, based on your own judgment of the activities in the watershed surrounding your site within a quarter of a mile. Enter a "1" if a land use is present and a "2" if it is clearly having a negative impact on the stream.
Visual biological survey
- Are fish present in the stream? Fish can indicate that the stream is of sufficient quality for other organisms.
- Barriers to the movement of fish in the stream are obstructions that would keep fish from moving freely upstream or downstream.
- Aquatic plants provide food and cover for aquatic organisms. Plants also might provide very general indications of stream quality. For example, streams that are overgrown with plants could be over enriched by nutrients. Streams devoid of plants could be affected by extreme acidity or toxic pollutants. Aquatic plants may also be an indicator of stream velocity because plants cannot take root in fast-flowing streams.
- Algae are simple plants that do not grow true roots, stems, or leaves and that mainly live in water, providing food for the food chain. Algae may grow on rocks, twigs, or other submerged materials, or float on the surface of the water. It naturally occurs in green and brown colors. Excessive algal growth may indicate excessive nutrients (organic matter or a pollutant such as fertilizer) in the stream.
Step 4 Complete all the field data sheets
After you have completed macroinvertebrate sampling, analysis of findings, and the habitat characterization, make sure you have completed the field data sheet to the extent possible and that the recorded data are legible. If you are not able to determine
how to answer a question on the field data sheet, just leave the space blank. Return all completed forms to your program coordinator.
Streamside Biosurvey:
Macroinvertebrates (PDF, 28.7 KB)
Streamside Biosurvey:
Habitat Walk (PDF, 22.3 KB)
Adobe Acrobat Reader is required to view PDF documents. The most recent version of the Adobe Acrobat Reader is available as a free download. An Adobe Acrobat plug-in for assisted technologies is also available.
< Previous · Table of Contents · Next >
Office of Wetlands, Oceans & Watersheds Home
Watershed Protection Home | Monitoring Water Quality Home
EPA Home |
Office of Water |
Search |
Comments