
|
|
Stream flow, or discharge, is the volume of water that moves over a designated point over a fixed period of time. It is often expressed as cubic feet per second (ft3/sec).
The flow of a stream is directly related to the amount of water moving off the watershed into the stream channel. It is affected by weather, increasing during rainstorms and decreasing during dry periods. It also changes during different seasons of the year, decreasing during the summer months when evaporation rates are high and shoreline vegetation is actively growing and removing water from the ground. August and September are usually the months of lowest flow for most streams and rivers in most of the country.
Water withdrawals for irrigation purposes can seriously deplete water flow, as can industrial water withdrawals. Dams used for electric power generation, particularly facilities designed to produce power during periods of peak need, often block the flow of a stream and later release it in a surge.
Flow is a function of water volume and velocity. It is important because of its impact on water quality and on the living organisms and habitats in the stream. Large, swiftly flowing rivers can receive pollution discharges and be little affected, whereas small streams have less capacity to dilute and degrade wastes.
Stream velocity, which increases as the volume of the water in the stream increases, determines the kinds of organisms that can live in the stream (some need fast-flowing areas; others need quiet pools). It also affects the amount of silt and sediment carried by the stream. Sediment introduced to quiet, slow-flowing streams will settle quickly to the stream bottom. Fast moving streams will keep sediment suspended longer in the water column. Lastly, fast-moving streams generally have higher levels of dissolved oxygen than slow streams because they are better aerated.
This section describes one method for estimating flow in a specific area or reach of a stream. It is adapted from techniques used by several volunteer monitoring programs and uses a float (an object such as an orange, ping-pong ball, pine cone, etc.) to measure stream velocity. Calculating flow involves solving an equation that examines the relationship among several variables including stream cross-sectional area, stream length, and water velocity. One way to measure flow is to solve the following equation:
|
|
||
| Where: | ||
| A | = | Average cross-sectional area of the stream (stream width multiplied by average water depth). |
| L | = | Length of the stream reach measured (usually 20 ft.) |
| C | = | A coefficient or correction factor (0.8 for rocky-bottom streams or 0.9 for muddy-bottom streams). This allows you to correct for the fact that water at the surface travels faster than near the stream bottom due to resistance from gravel, cobble, etc. Multiplying the surface velocity by a correction coefficient decreases the value and gives a better measure of the stream's overall velocity. |
| T | = | Time, in seconds, for the float to travel the length of L |
Refer to section 2.3 - Safety Considerations for details on confirming sampling date and time, safety considerations, checking supplies, and checking weather and directions. In addition to the standard sampling equipment and apparel, when measuring and calculating flow, include the following equipment:
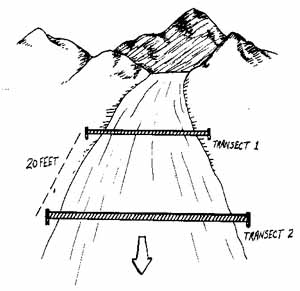 Figure 5.4 A diagram of a 20-foot transect |
To measure cross-sectional area:
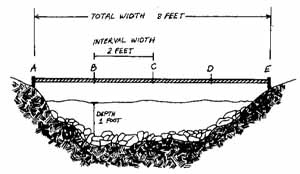 Figure 5.5 A cross section view to measure stream width and depth |
The volunteer who lets the orange go at the upstream transect should position it so it flows into the fastest current. The clock stops when the orange passes fully under the downstream transect line. Once under the transect line, the orange can be scooped out of the water with the fishing net. This "time of travel" measurement should be conducted at least three times and the results averaged--the more trials you do, the more accurate your results will be. The averaged results are equal to T in the formula. It is a good idea to float the orange at different distances from the bank to get various velocity estimates. You should discard any float trials if the object gets hung up in the stream (by cobbles, roots, debris, etc.)
| Flow = ALC / T |
Continuing the example in Fig. 5.6. say the average time of travel for the orange between Transect #1 and #2 is 15 seconds and the stream had a rocky bottom. The calculation of flow would be:
| Where: | ||
| A | = | 5.42 ft2 |
| L | = | 20 ft |
| C | = | 0.8 (coefficient for a rocky-bottom stream) |
| T | = | 15 seconds |
| Flow = 15 seconds (5.42 ft2) (20 ft) (0.8) / 15 sec. | ||
| Flow = 86.72 ft3/ 15 sec. | ||
| Flow = 5.78 ft3/sec. |
Mitchell, M.K., and W. Stapp. Field Manual for Water Quality Monitoring. 5th Edition. Thompson Shore Printers.
Missouri Stream Teams. Volunteer Water Quality Monitoring. Missouri Department of Natural Resources, P.O. Box 176, Jefferson City, MO 65102.
Data Form for Calculating Flow (PDF, 82.8 KB)
Adobe Acrobat Reader is required to view PDF documents. The most recent version of the Adobe Acrobat Reader is available as a free download. An Adobe Acrobat plug-in for assisted technologies is also available.
EPA Home | Office of Water | Search | Comments