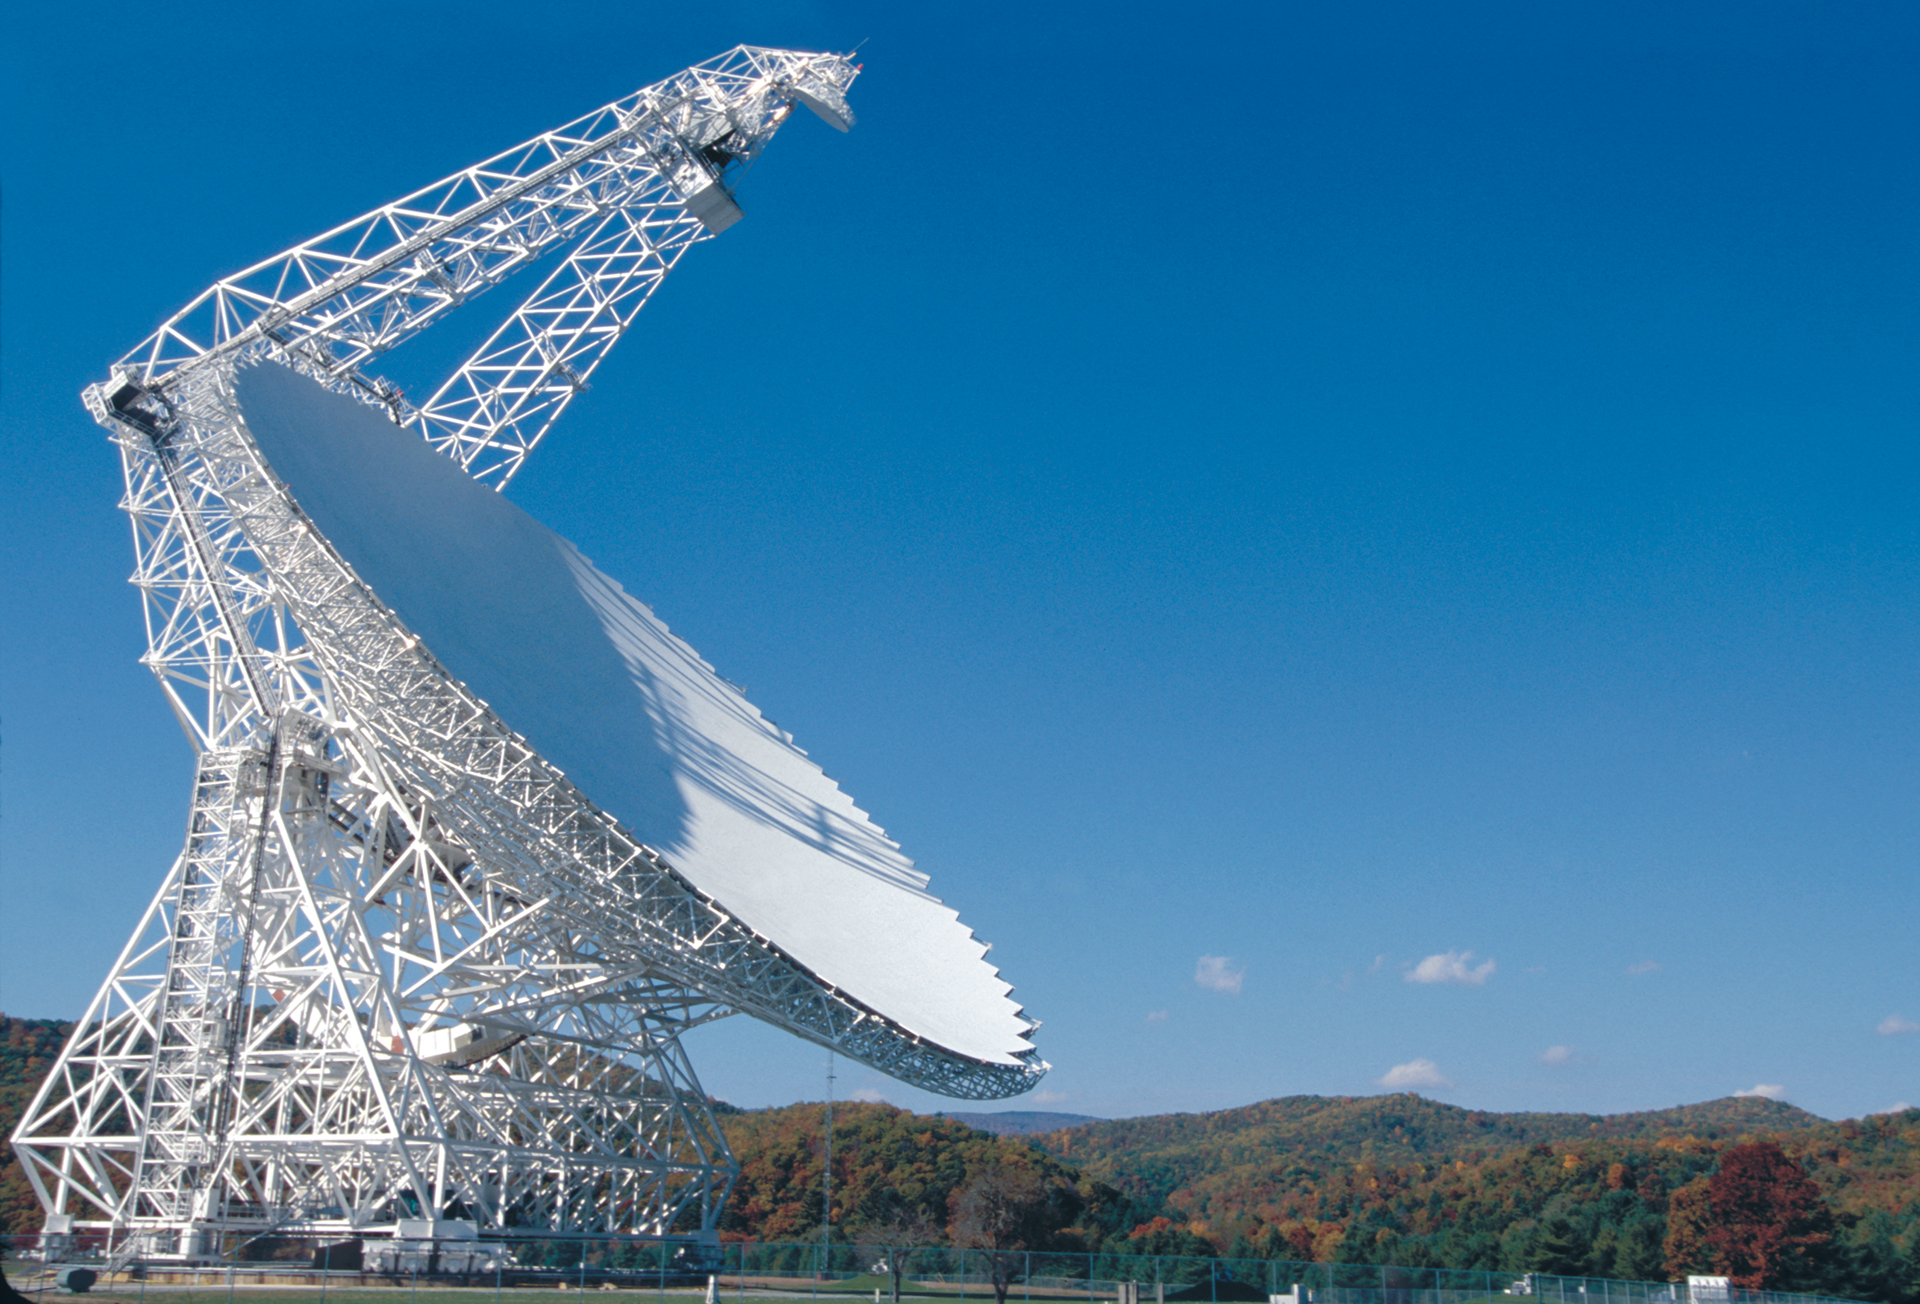
Figure 8.1: The 100-m Green Bank Telescope
(GBT). Image credit: NRAO/AUI/NSF.Figure 8.2: The 305-m Arecibo Telescope. Image
courtesy of the NAIC–Arecibo Observatory, a facility of the
NSF.
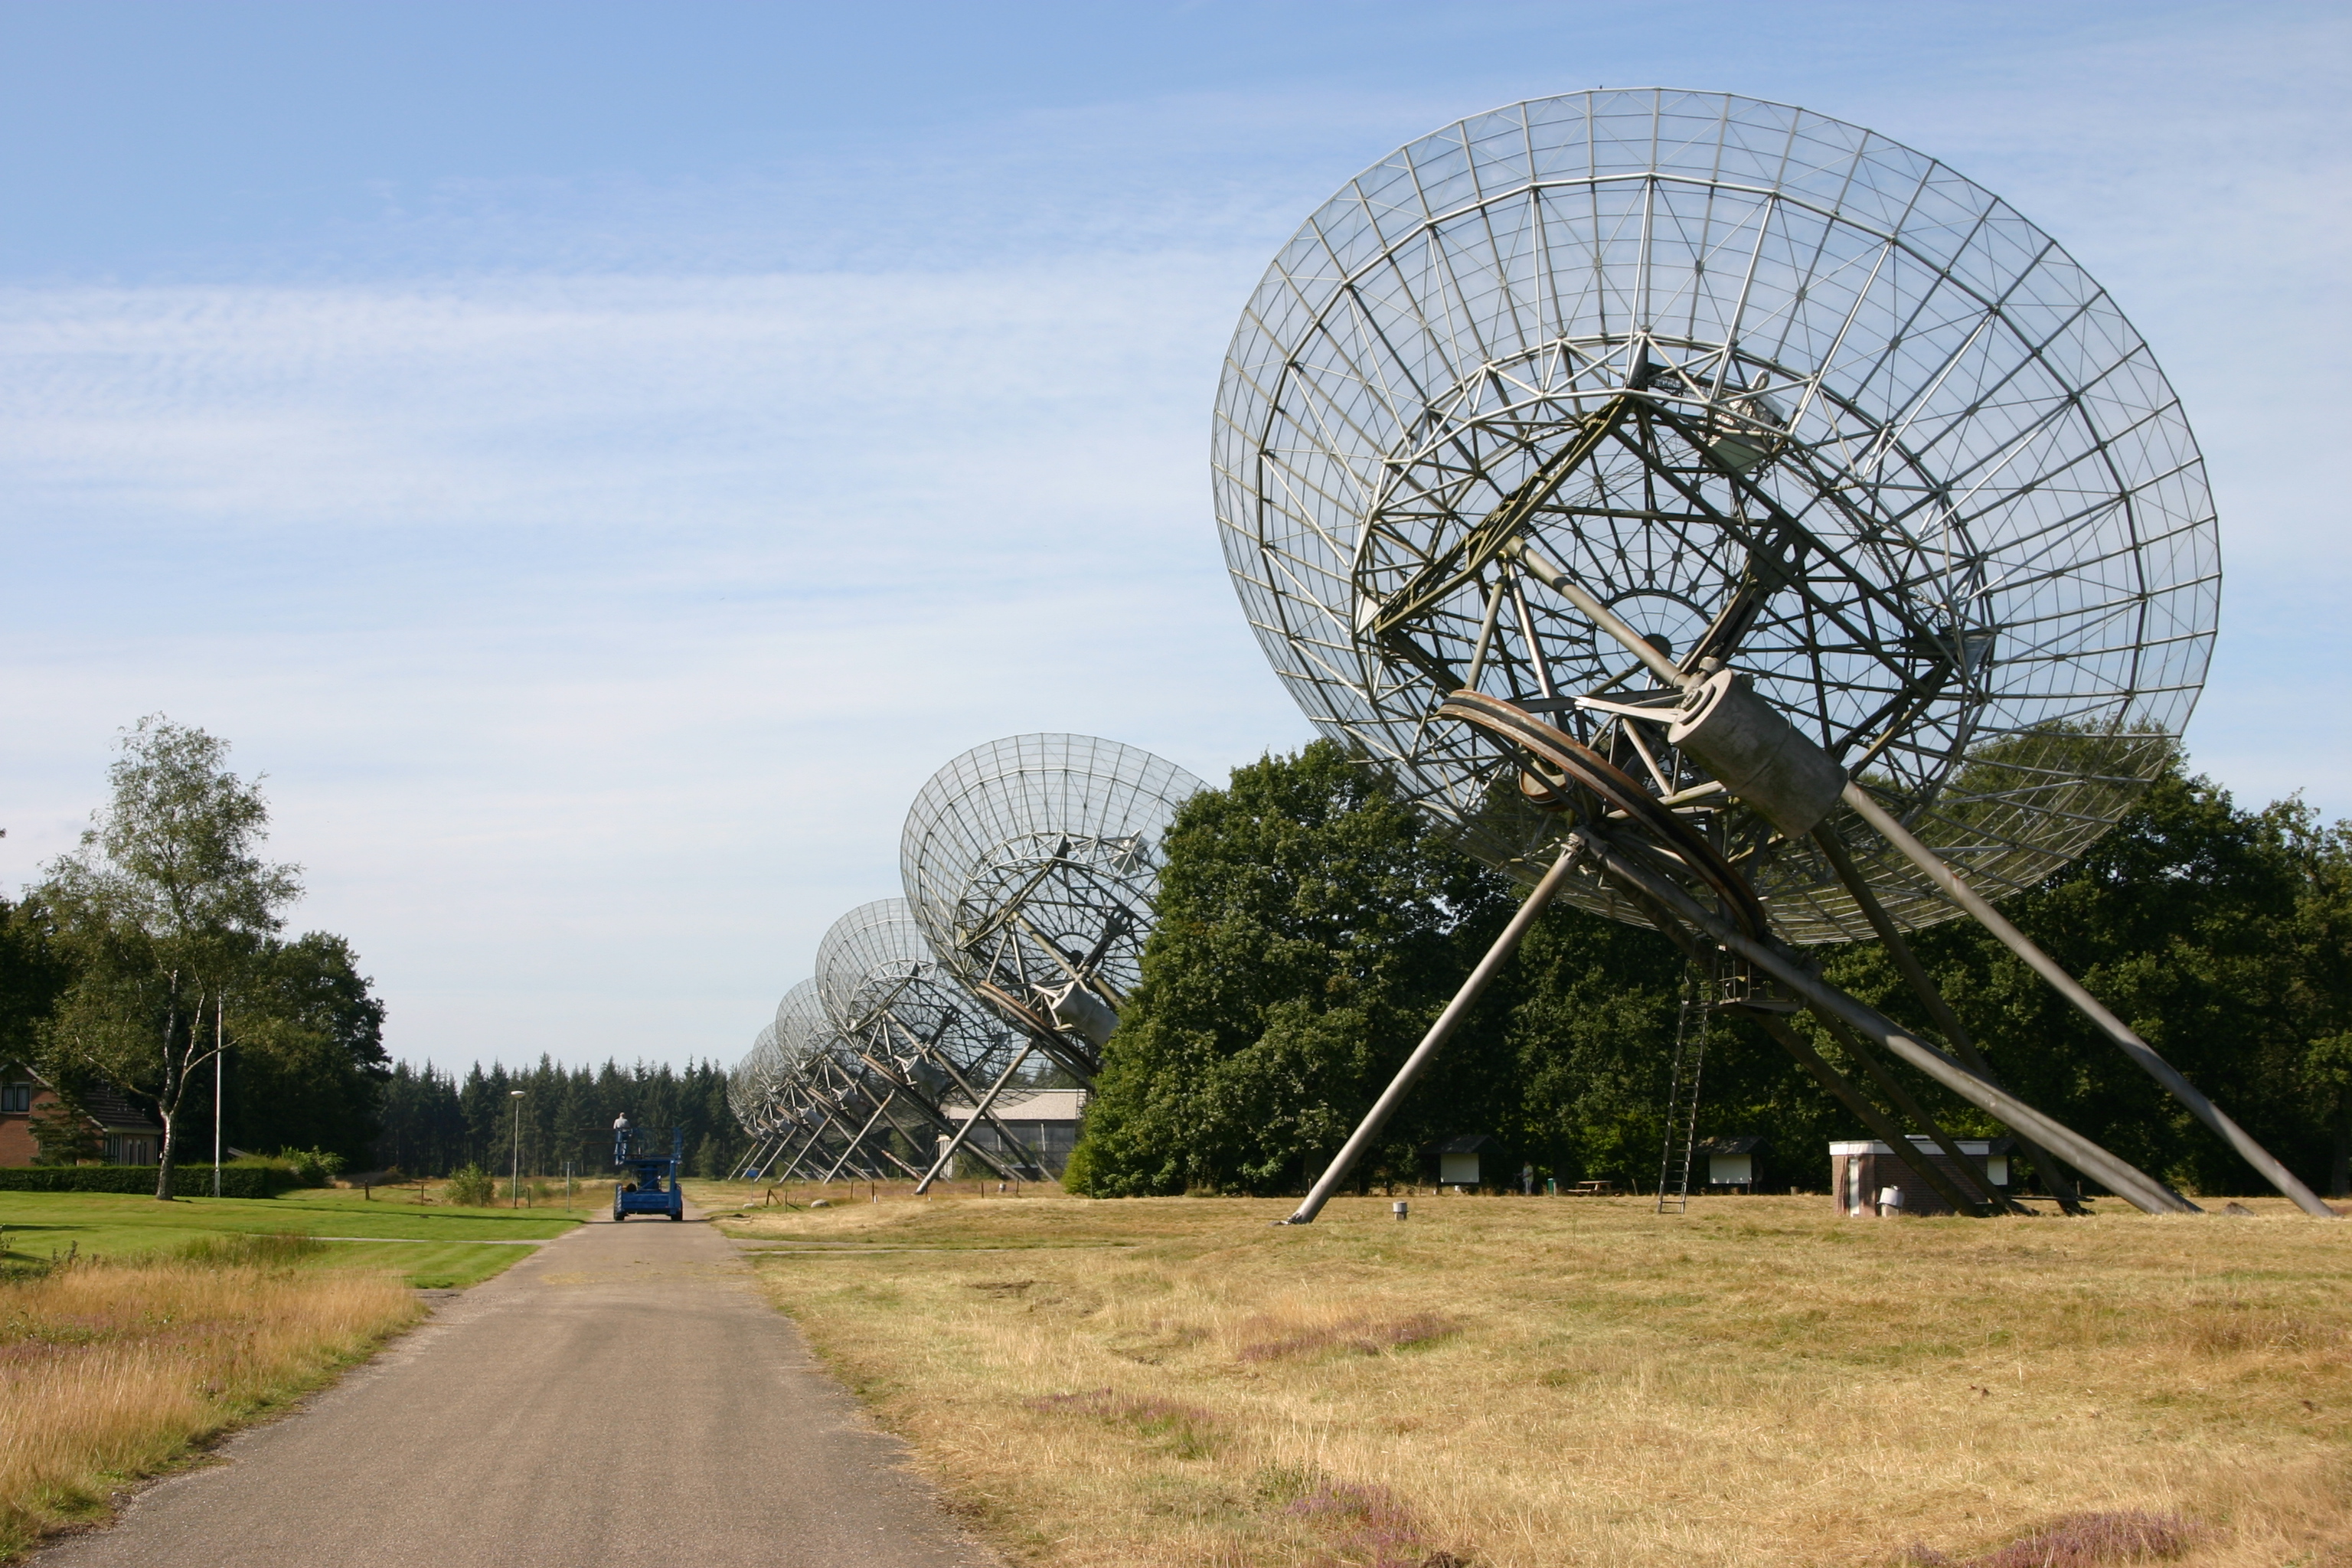
Figure 8.3: The Westerbork Synthesis Radio Telescope (WSRT) is an
east–west linear array of equatorially mounted dishes. Image courtesy of Adrian
Renting. Figure 8.4: The 1 km “D” configuration of the Jansky Very Large Array
(VLA) of 27 25-m telescopes located on the plains of San Augustin in
New Mexico at 2100 m elevation. Image credit:
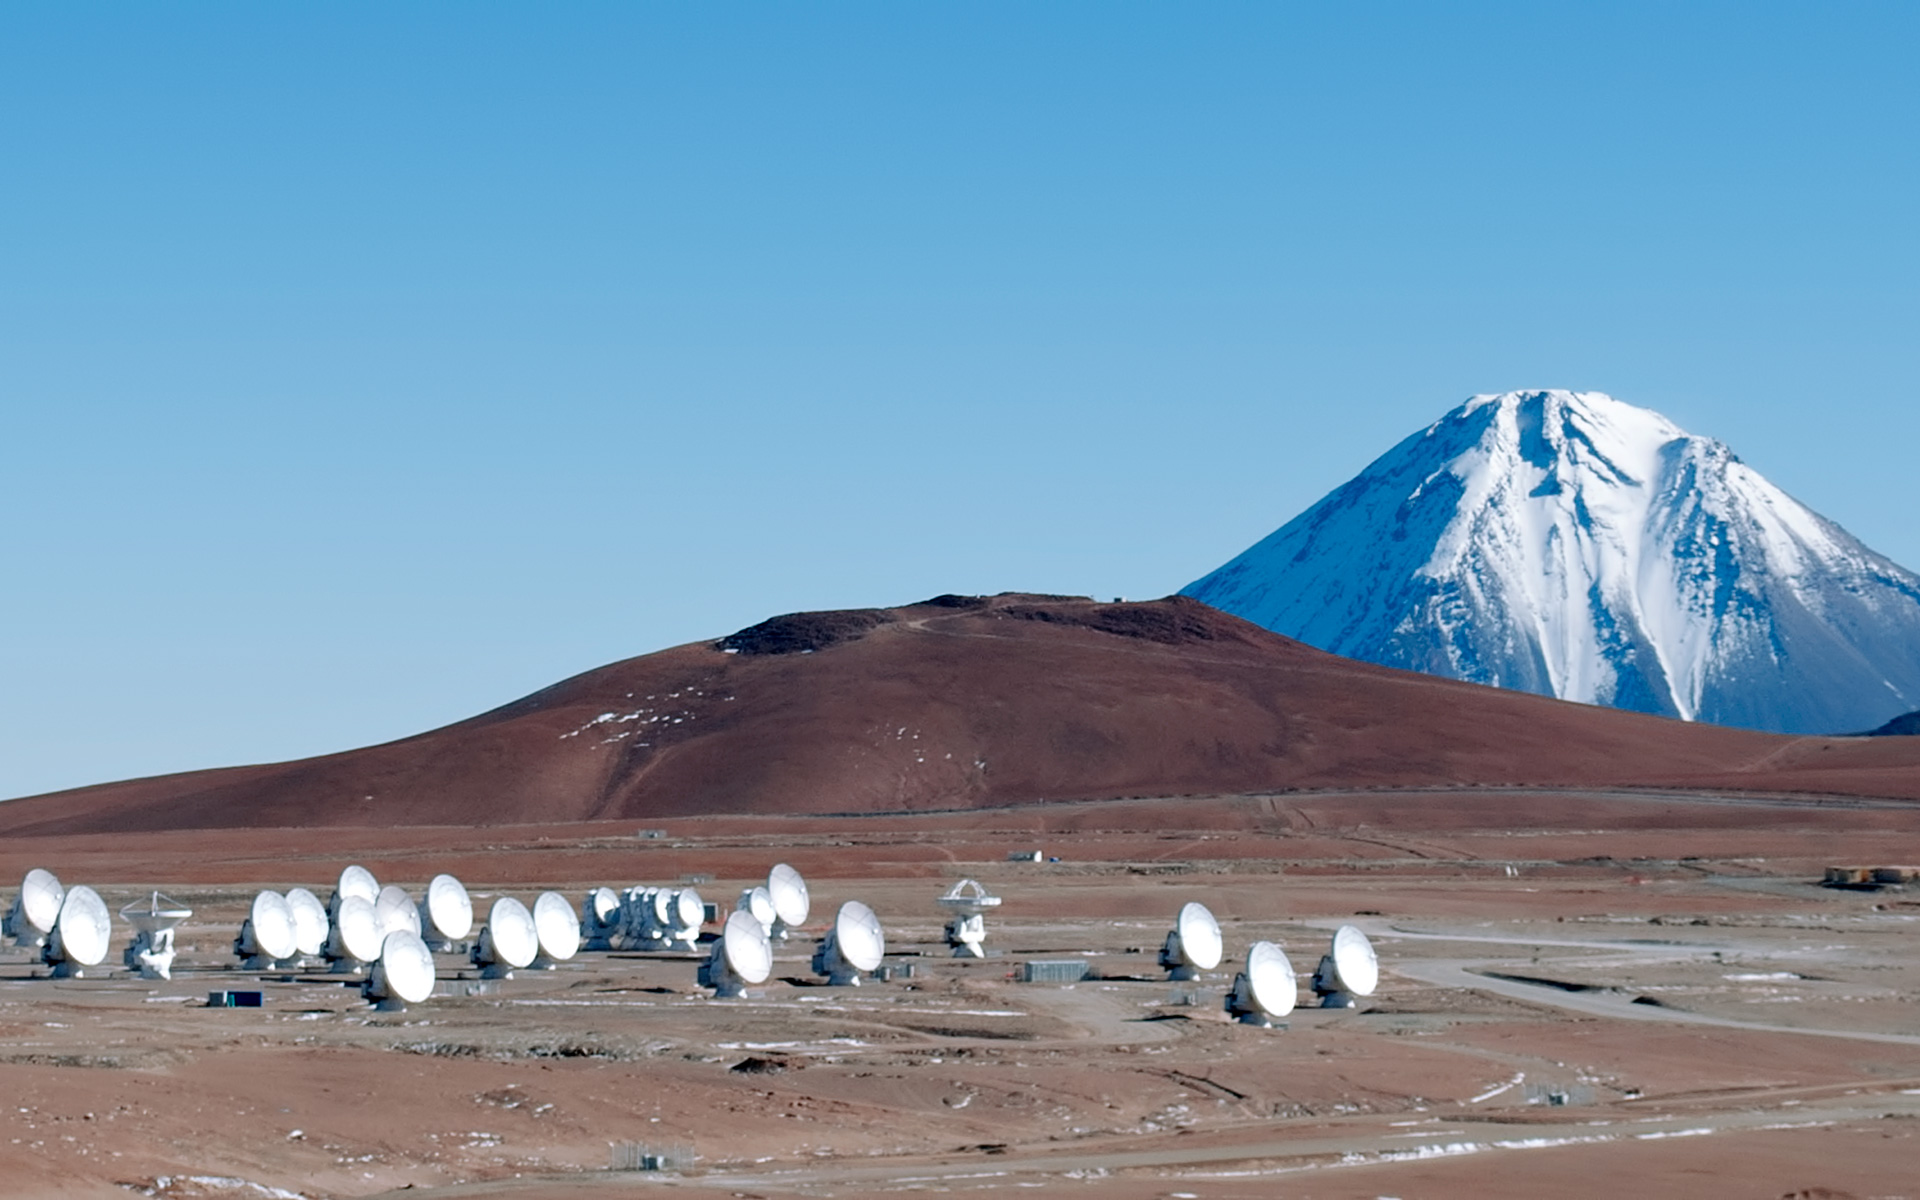
NRAO/AUI/NSF.Figure 8.5: The Atacama Large
Millimeter Array (ALMA) is on an extremely high (5000 m) and dry
desert plain near Cerro Chajnator in Chile. Image credit: ALMA (ESO/NAOJ/NRAO),
J. Guarda (ALMA).
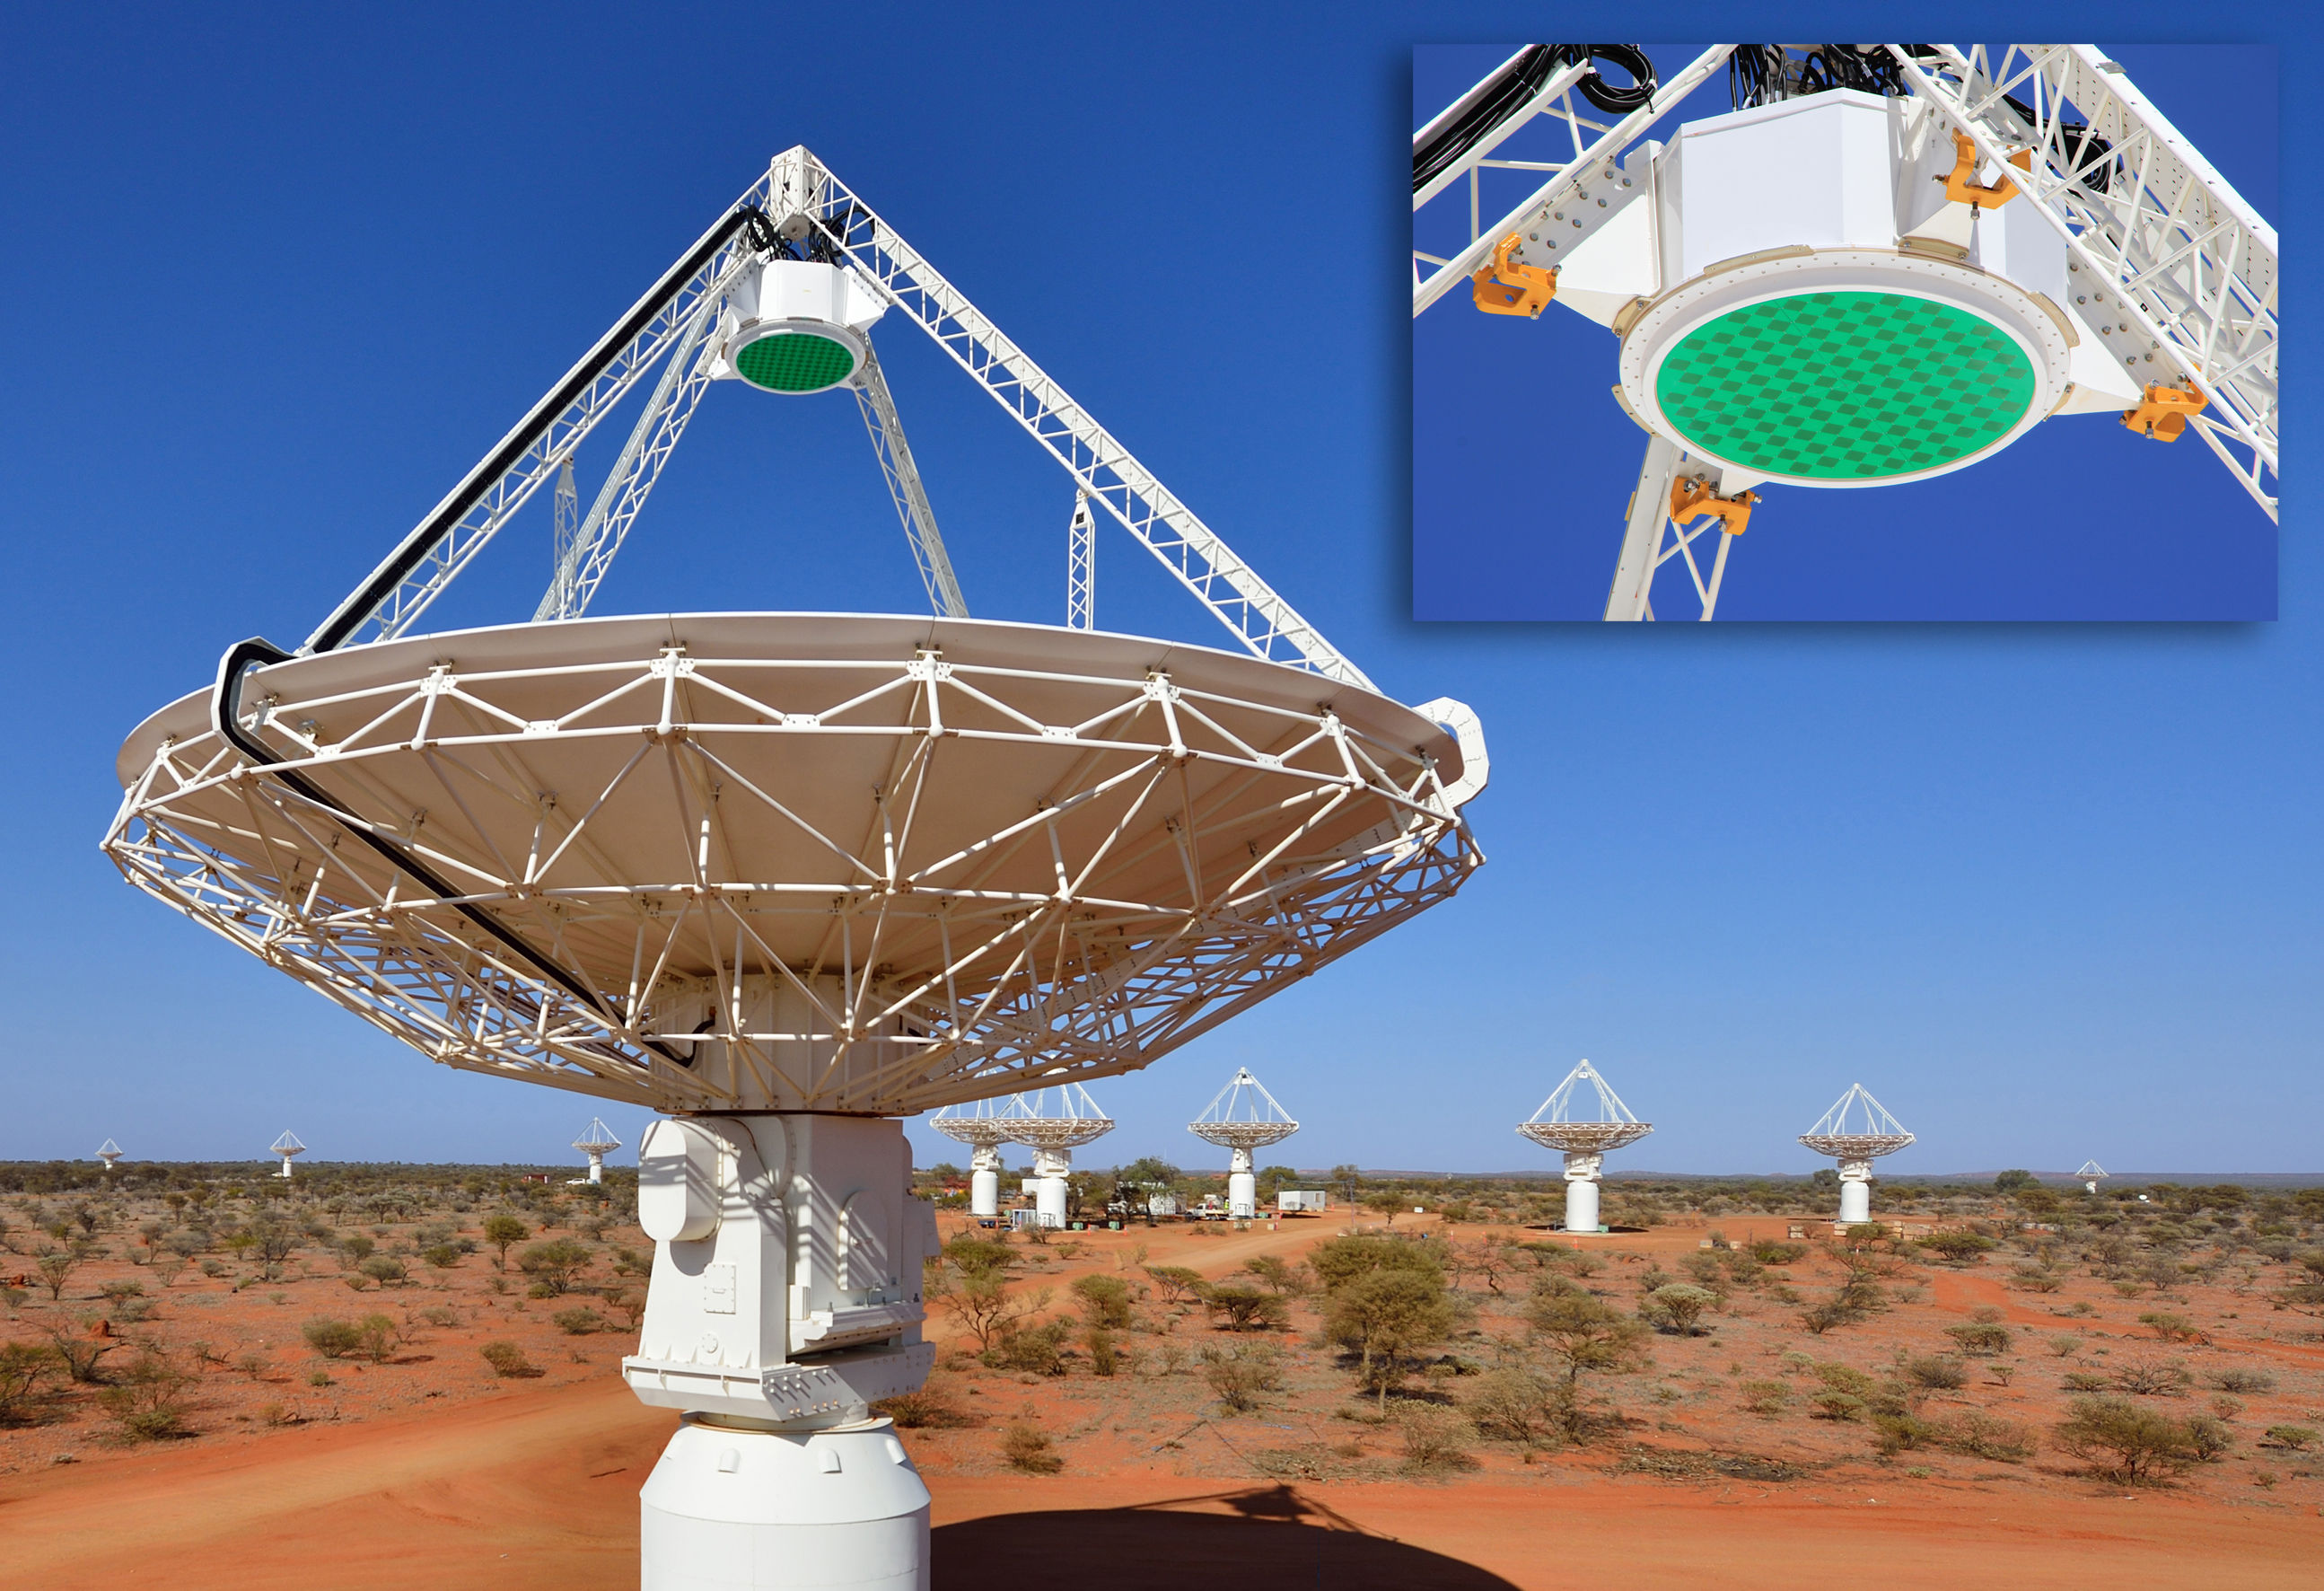
Figure 8.6: The CSIRO Australian Square Kilometre Array Pathfinder
(ASKAP) with its multibeam phased-array feed designed to survey the
sky rapidly. Image
credit: CSIRO and Natasha Hurley-Walker.
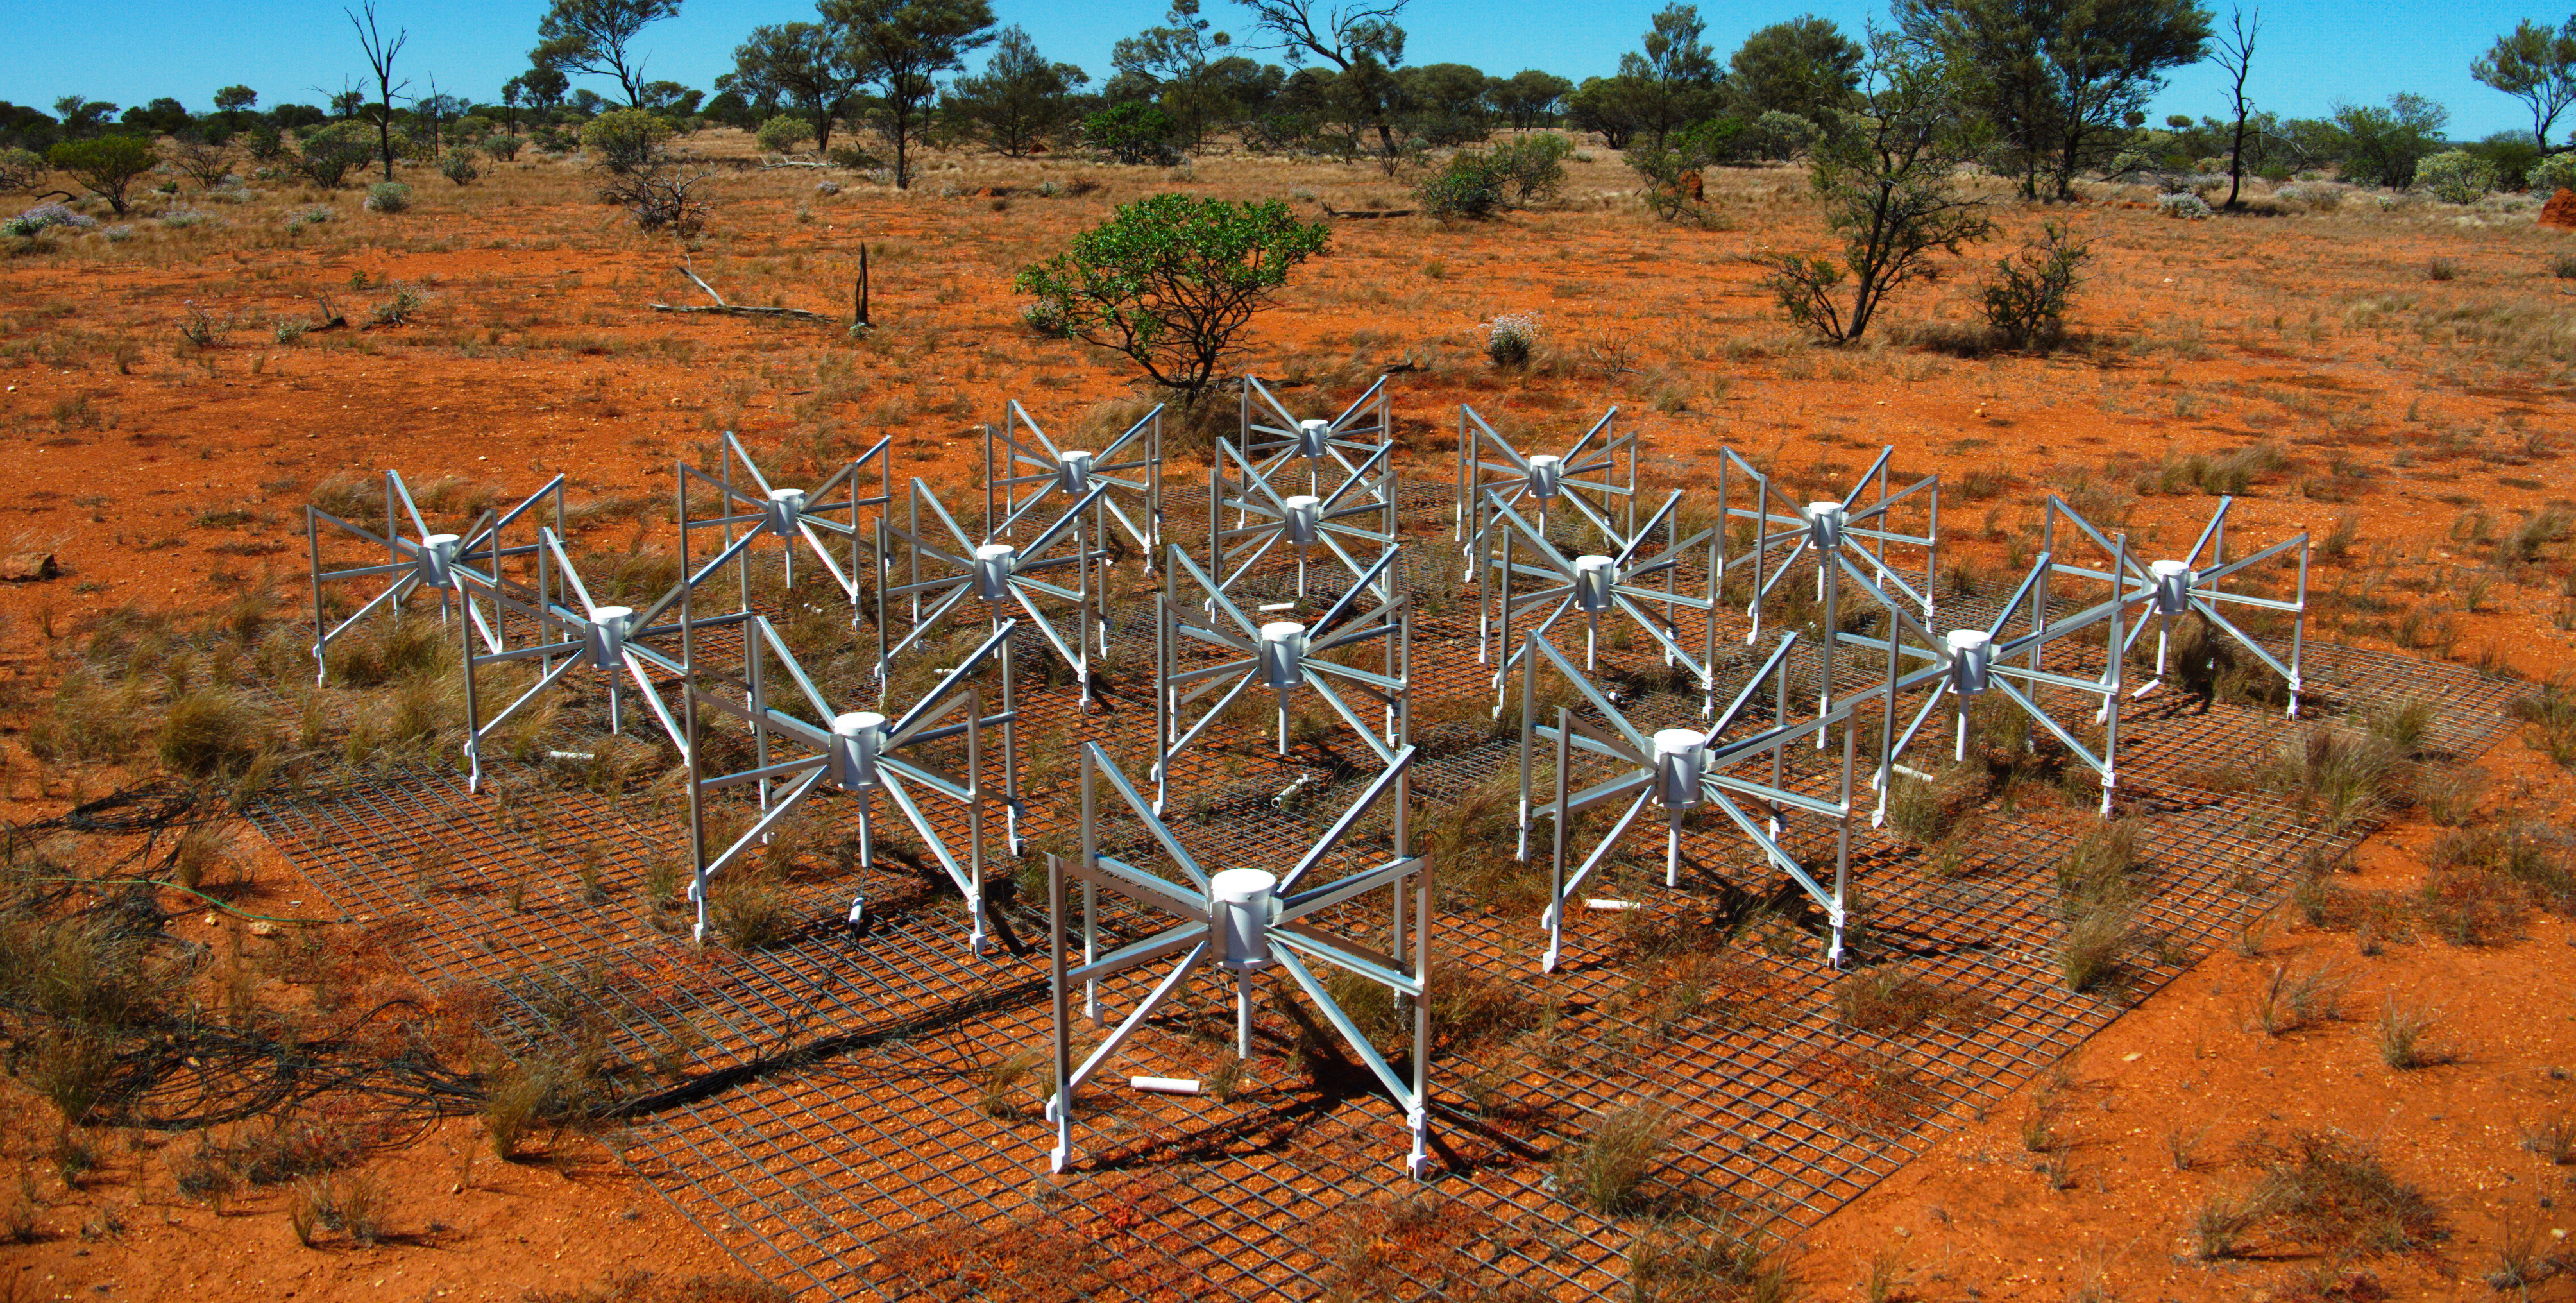
Figure 8.7: One tile of the Murchison Widefield Array
(MWA).[107] Image
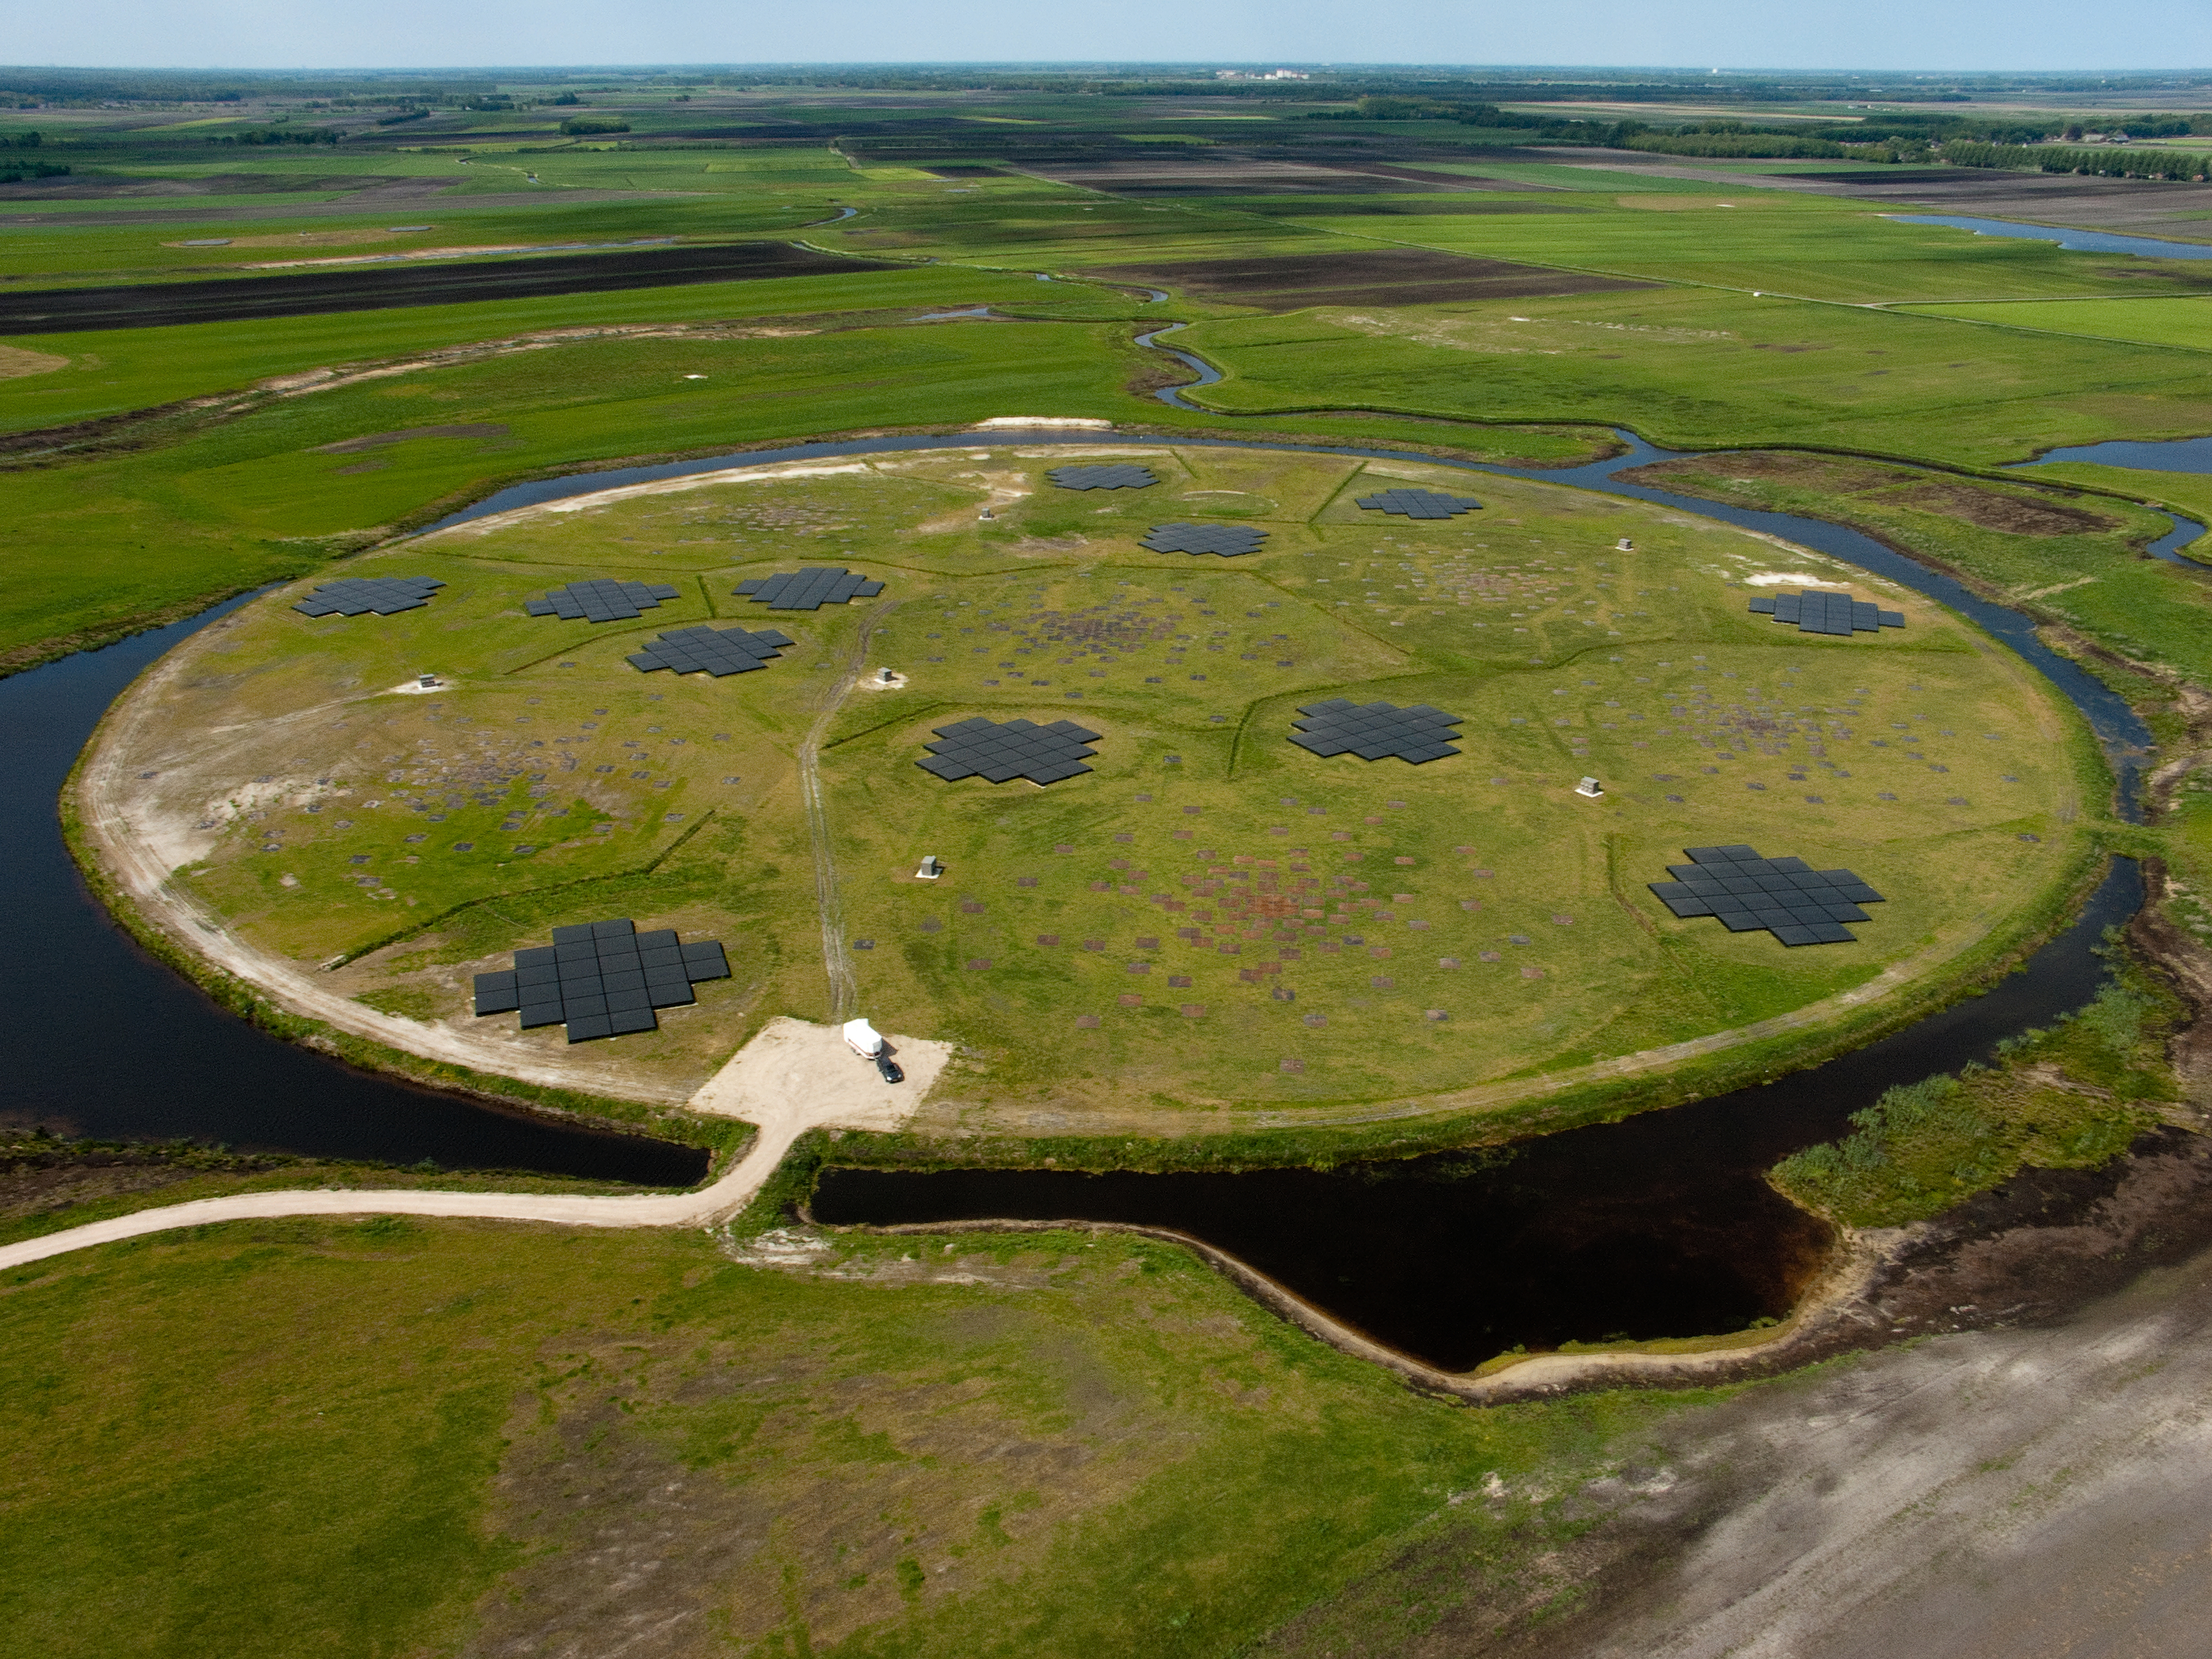
credit: CSIRO. Figure 8.8: The core of LOFAR (LOw Frequency Array for Radio
astronomy). Image credit:
ASTRON and Top-Foto, Assen.
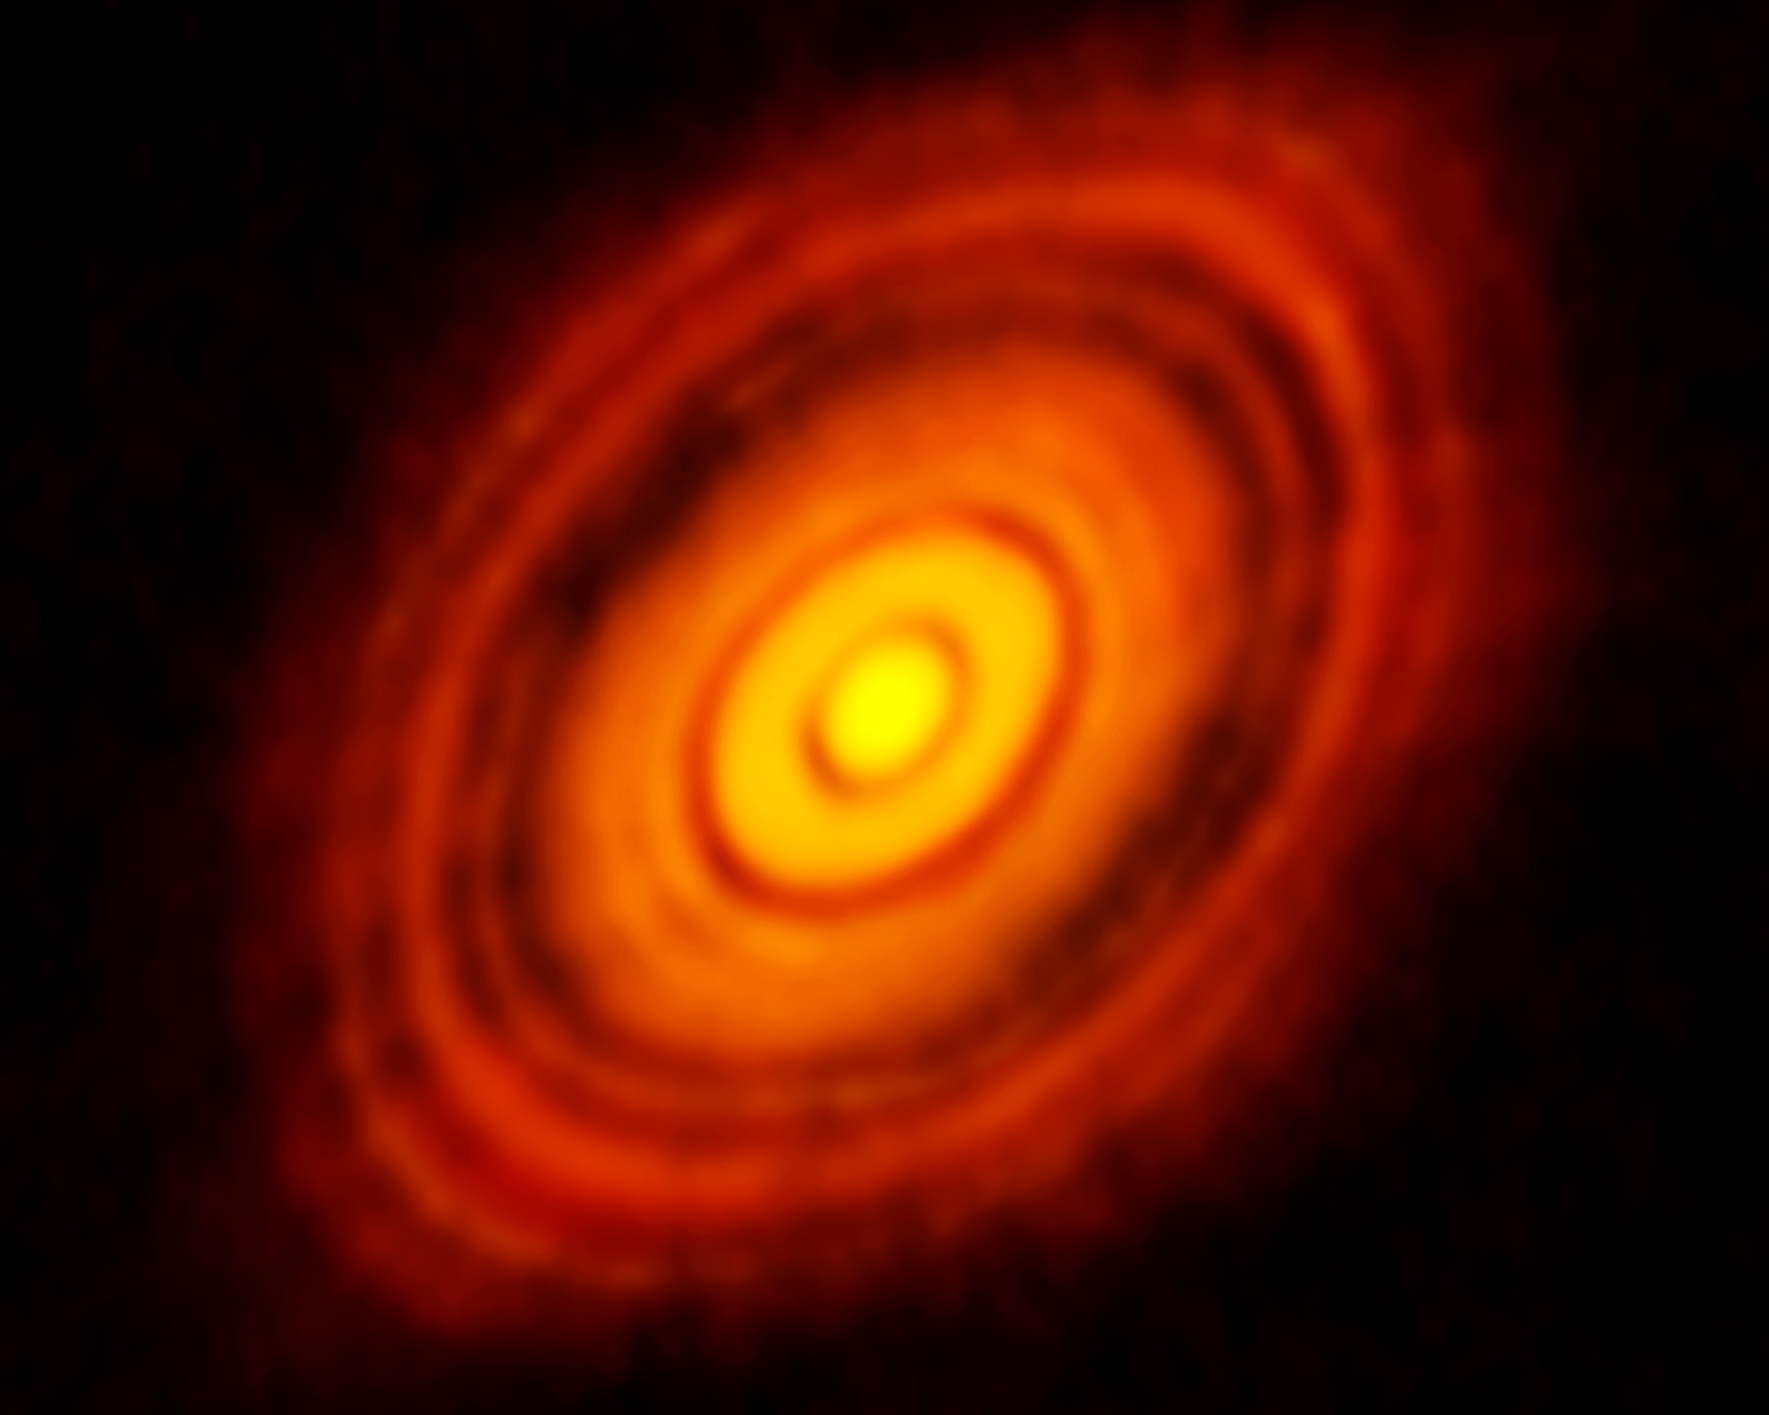
Figure 8.9: Dust emission from the protoplanetary disk of HL Tau. Image credit:
ALMA (NRAO/ESO/NAOJ); C. Brogan, B. Saxton (NRAO/AUI/NSF).
Figure 8.10: Composite image of
the Crab Nebula.
Blue indicates X-rays (from Chandra), green is
optical (from the HST), and red is radio (from the VLA).
Image credit: J. Hester (ASU), CXC, HST, NRAO, NSF, NASA.
Figure 8.11: The 21-cm Hi line highlights cold
hydrogen tidally torn from the galaxies in the M81 group
[118]. Image credit: NRAO/AUI/NSF
Investigators: Min S. Yun, Paul T. P. Ho, & K. Y. Lo.
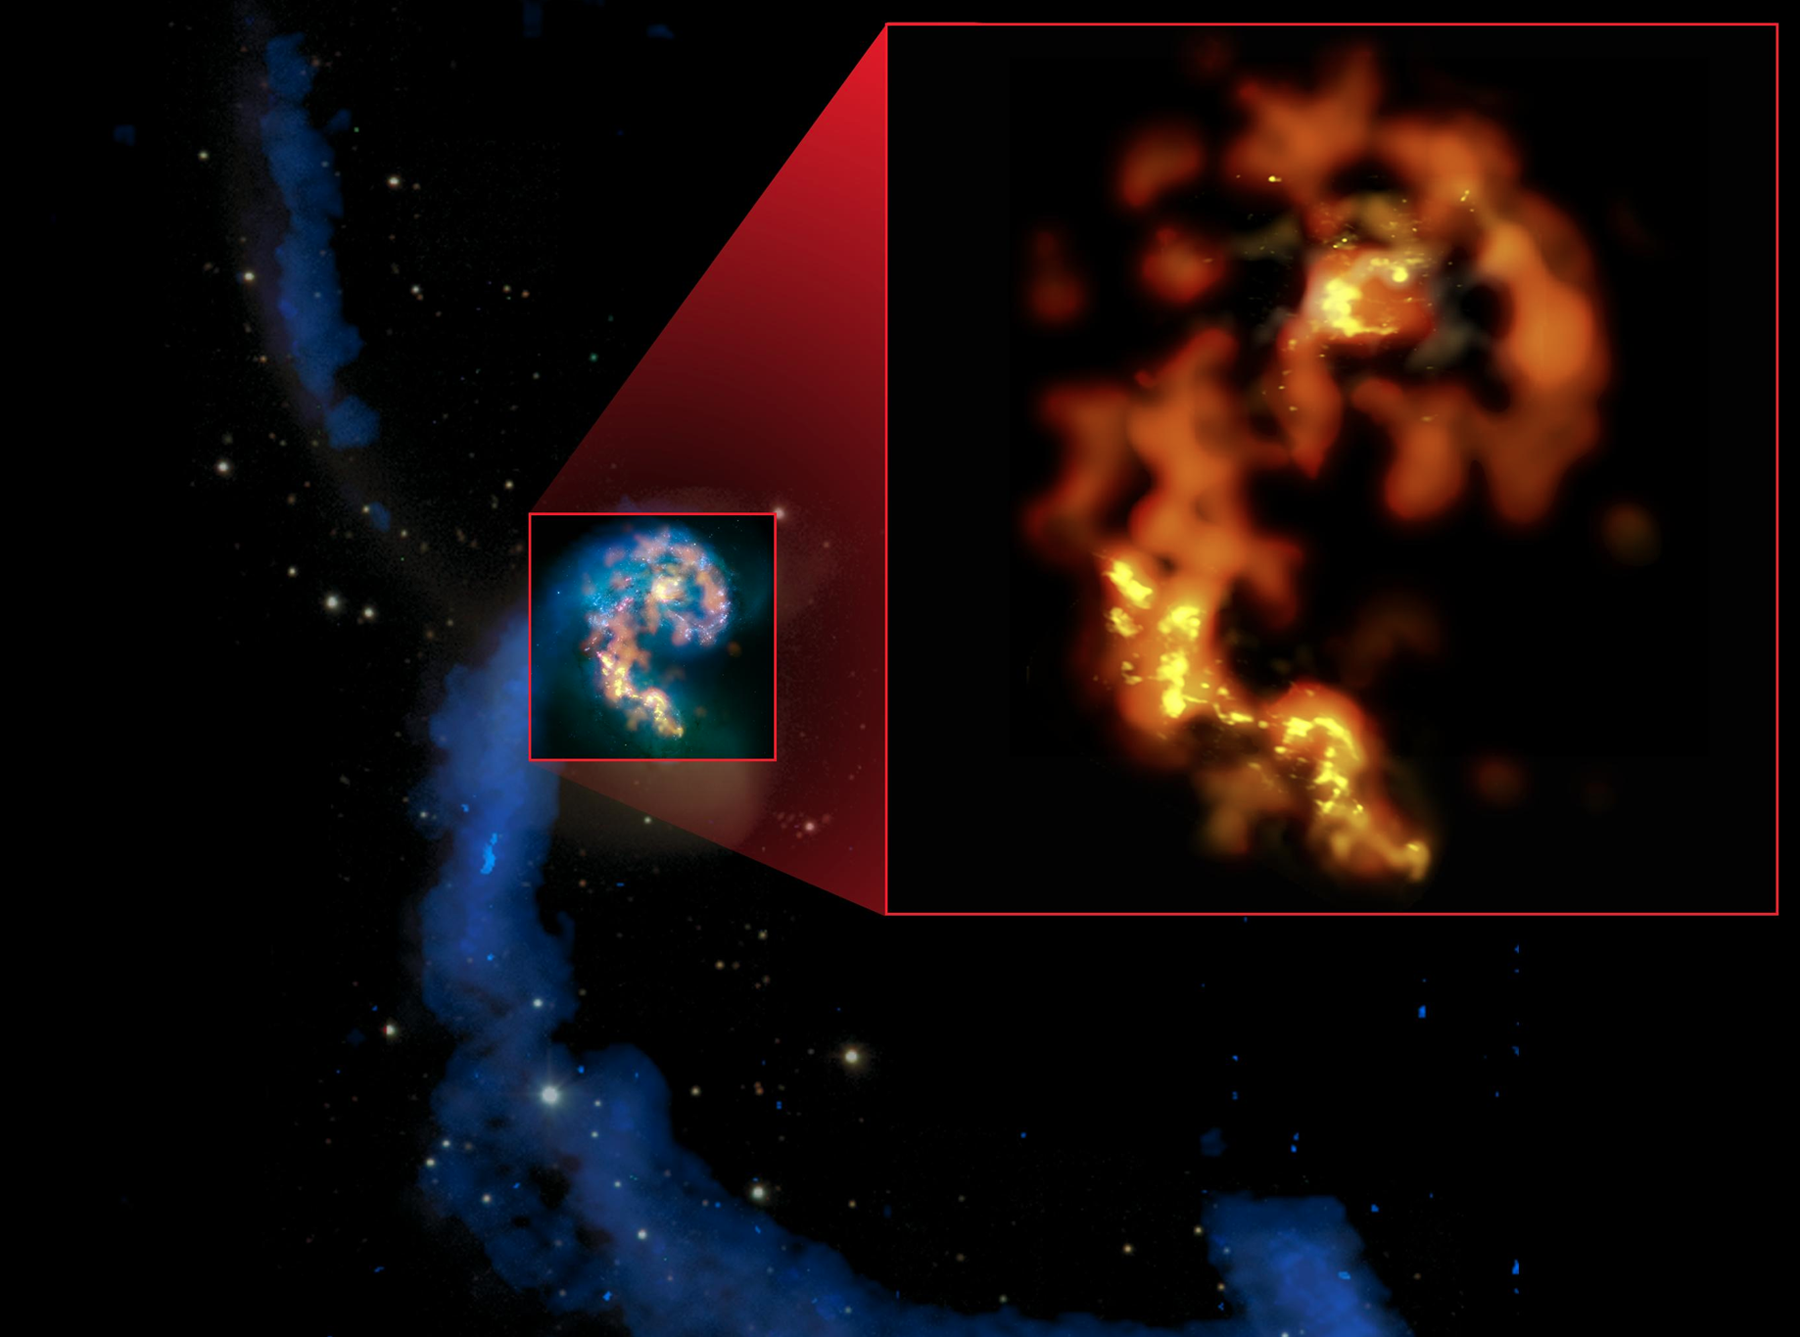
Figure 8.12: The interaction history of the
Antennae Galaxies NGC 4038 and NGC 4039 is
revealed by their long Hi tidal tails (blue) and obscured
star formation traced by CO emission (orange insert). Image credit:
B. Saxton (NRAO/AUI/NSF) from data provided by ALMA (ESO/NAOJ/NRAO)
and NASA/ESA.
Figure 8.13: Radio continuum emission from M82. Image
credit: Josh Marvil (NM Tech/NRAO), Bill Saxton (NRAO/AUI/NSF),
Hubble (NASA/ESA/STScI).
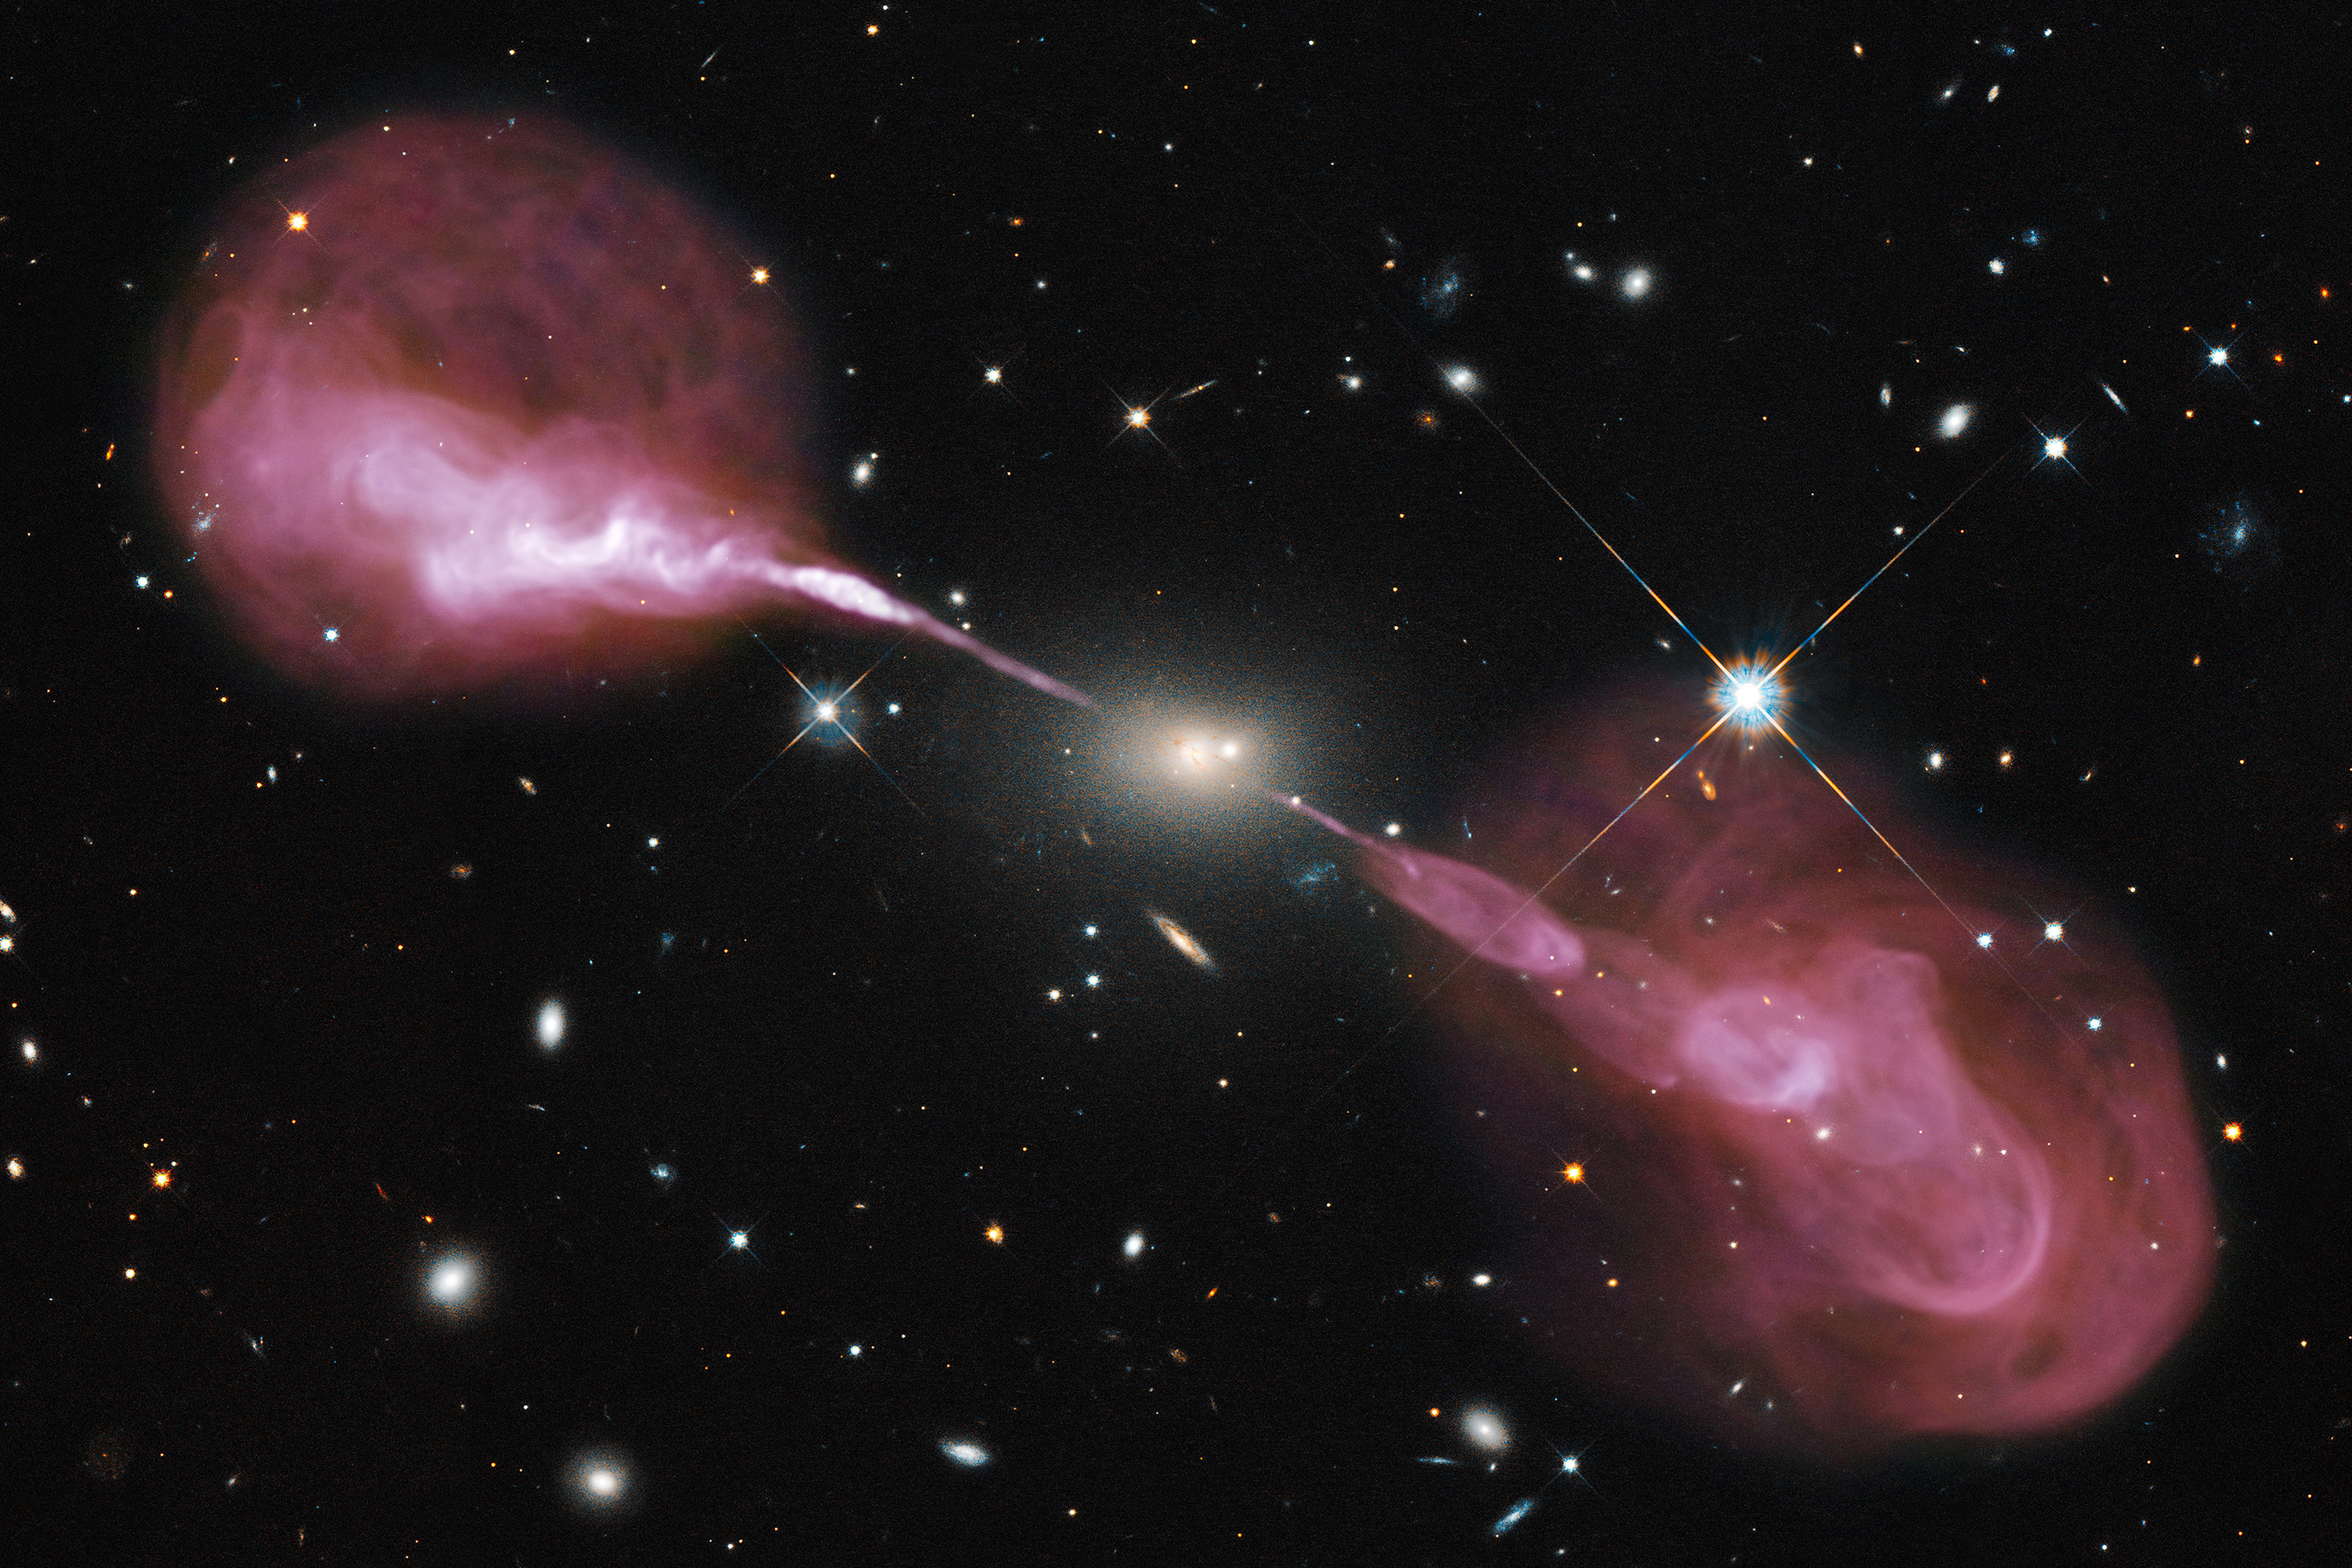
Figure 8.14: The radio galaxy Hercules A (3C 348). Image credit: NASA, ESA, S. Baum and C. O’Dea (RIT), R. Perley
and W. Cotton (NRAO/AUI/NSF), and the Hubble Heritage Team
(STScI/AURA).
Figure 8.15: The radio source (red) in the galaxy
cluster MS0735.6+7421 has displaced the X-ray emitting gas (blue)
[71]. Image credit: NASA, ESA, CXC, STScI, B. McNamara,
NRAO/AUI/NSF, and L. Birzan & team.
Figure 8.16: Cosmic microwave background fluctuations
[105].