5.6
Phosphorus
Why is phosphorus important?
Both phosphorus and nitrogen are essential nutrients for the plants and animals
that make up the aquatic food web. Since phosphorus is the nutrient in short
supply in most fresh waters, even a modest increase in phosphorus can, under the
right conditions, set off a whole chain of undesirable events in a stream including
accelerated plant growth, algae blooms, low dissolved oxygen, and the death of
certain fish, invertebrates, and other aquatic animals.
There are many sources of phosphorus, both natural and human. These include
soil and rocks, wastewater treatment plants, runoff from fertilized lawns and
cropland, failing septic systems, runoff from animal manure storage areas,
disturbed land areas, drained wetlands, water treatment, and commercial cleaning
preparations.
Forms of phosphorus
Phosphorus has a complicated story. Pure, "elemental" phosphorus (P) is rare. In nature, phosphorus usually exists as part of a phosphate molecule (PO4). Phosphorus in aquatic systems occurs as organic phosphate and inorganic phosphate. Organic
phosphate
consists of a phosphate molecule associated with a carbon-based molecule, as in plant or animal tissue.
Phosphate that is not associated with organic material is
inorganic. Inorganic phosphorus is the form required by plants. Animals can use either organic or inorganic phosphate.
Both organic and inorganic phosphorus can either be dissolved in the water or suspended (attached to particles in the water column).
The phosphorus cycle
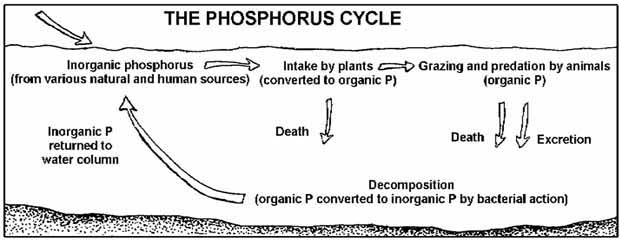
Figure 5.12
The phosphorus cycle
Phosphorus changes form as it cycles through the aquatic environment.
|
Phosphorus cycles through the environment,
changing form as it does so (Fig. 5.12). Aquatic
plants take in dissolved inorganic phosphorus and
convert it to organic phosphorus as it becomes part of their
tissues. Animals get the organic phosphorus they need by eating
either aquatic plants, other animals, or decomposing plant
and animal material.
As plants and animals excrete
wastes or die, the organic
phosphorus they contain sinks
to the bottom, where bacterial
decomposition converts it back
to inorganic phosphorus, both
dissolved and attached to
particles. This inorganic
phosphorus gets back into the
water column when the bottom
is stirred up by animals, human
activity, chemical interactions,
or water currents. Then it is
taken up by plants and the cycle
begins again.
In a stream system, the
phosphorus cycle tends to move
phosphorus downstream as the
current carries decomposing
plant and animal tissue and
dissolved phosphorus. It
becomes stationary only when it
is taken up by plants or is
bound to particles that settle to
the bottom of pools.
In the field of water quality
chemistry, phosphorus is
described using several terms.
Some of these terms are
chemistry based (referring to
chemically based compounds),
and others are methods-based
(they describe what is measured
by a particular method).
The term "orthophosphate" is a
chemistry-based term that refers
to the phosphate molecule all by
itself. "Reactive phosphorus" is
a corresponding method-based
term that describes what you
are actually measuring when you
perform the test for
orthophosphate. Because the
lab procedure isn't quite perfect,
you get mostly orthophosphate
but you also get a small fraction
of some other forms.
More complex inorganic
phosphate compounds are
referred to as "condensed
phosphates" or
"polyphosphates." The
method-based term for these
forms is "acid hydrolyzable."
Monitoring phosphorus
Monitoring phosphorus is
challenging because it involves
measuring very low
concentrations down to 0.01
milligram per liter (mg/L) or
even lower. Even such very low
concentrations of phosphorus
can have a dramatic impact on
streams. Less sensitive methods should be used only to identify serious problem
areas.
While there are many tests for phosphorus, only four are likely to be
performed by volunteer monitors.
- The total orthophosphate test is largely a measure of orthophosphate.
Because the sample is not filtered, the procedure measures both dissolved
and suspended orthophosphate. The EPA-approved method for measuring
total orthophosphate is known as the ascorbic acid method. Briefly, a reagent
(either liquid or powder) containing ascorbic acid and ammonium molybdate reacts
with orthophosphate in the sample to form a blue compound. The intensity of
the blue color is directly proportional to the amount of orthophosphate in the
water.
- The total phosphorus test measures all the forms of phosphorus in the
sample (orthophosphate, condensed phosphate, and organic phosphate). This
is accomplished by first "digesting" (heating and acidifying) the sample to
convert all the other forms to orthophosphate. Then the orthophosphate is
measured by the ascorbic acid method. Because the sample is not filtered,
the procedure measures both dissolved and suspended orthophosphate.
- The dissolved phosphorus test measures that fraction of the total
phosphorus which is in solution in the water (as opposed to being attached to
suspended particles). It is determined by first filtering the sample, then analyzing
the filtered sample for total phosphorus.
- Insoluble phosphorus is calculated by subtracting the dissolved
phosphorus result from the total phosphorus result.
All these tests have one thing in common they all depend on measuring orthophosphate. The
total orthophosphate test measures the orthophosphate that is already present in the sample. The
others measure that which is already present and that which is formed when the other forms of
phosphorus are converted to orthophosphate by digestion.
Sampling and equipment considerations
Monitoring phosphorus involves two basic steps:
- Collecting a water sample
- Analyzing it in the field or lab for one of the types of phosphorus described above.
This manual does not address laboratory methods. Refer to the references cited at the end of this
section.
Sample Containers
Sample containers made of either some form of plastic or Pyrex glass are acceptable to EPA.
Because phosphorus molecules have a tendency to "adsorb" (attach) to the inside surface of
sample containers, if containers are to be reused they must be acid-washed to remove adsorbed
phosphorus. Therefore, the container must be able to withstand repeated contact with
hydrochloric acid. Plastic containers either high-density polyethylene or polypropylene might
be preferable to glass from a practical standpoint because they will better withstand breakage.
Some programs use disposable, sterile, plastic Whirl-pak® bags. The size of the container will
depend on the sample amount needed for the phosphorus analysis method you choose and the
amount needed for other analyses you intend to perform.
Dedicated Labware
All containers that will hold water samples or come into
contact with reagents used in this test must be dedicated. That
is, they should not be used for other tests. This is to eliminate
the possibility that reagents containing phosphorus will
contaminate the labware. All labware should be acid-washed.
The only form of phosphorus this manual recommends for
field analysis is total orthophosphate, which uses the
ascorbic acid method on an untreated sample. Analysis of any
of the other forms requires adding potentially hazardous
reagents, heating the sample to boiling, and using too much time
and too much equipment to be practical. In addition, analysis
for other forms of phosphorus is prone to errors and inaccuracies
in a field situation. Pretreatment and analysis for these other
forms should be handled in a laboratory.
Ascorbic Acid Method
In the ascorbic acid method, a combined liquid or
prepackaged powder reagent, consisting of sulfuric acid,
potassium antimonyl tartrate, ammonium molybdate, and
ascorbic acid (or comparable compounds), is added to either 50
or 25 mL of the water sample. This colors the sample blue in
direct proportion to the amount of orthophosphate in the
sample. Absorbance or transmittance is then measured after 10
minutes, but before 30 minutes, using a color comparator with
a scale in milligrams per liter that increases with the increase in
color hue, or an electronic meter that measures the amount of
light absorbed or transmitted at a wavelength of 700 - 880
nanometers (again depending on manufacturer's directions).
A color comparator may be useful for identifying heavily
polluted sites with high concentrations (greater than 0.1
mg/L). However, matching the color of a treated sample to a
comparator can be very subjective, especially at low
concentrations, and can lead to
variable results.
A field spectrophotometer or
colorimeter with a 2.5-cm light
path and an infrared photocell
(set for a wavelength of
700-880 nm) is recommended
for accurate determination of
low concentrations (between
0.2 and 0.02 mg/L ). Use of a
meter requires that you prepare
and analyze known standard
concentrations ahead of time in
order to convert the absorbance
readings of your stream sample
to milligrams per liter, or that
your meter reads directly as
milligrams per liter.
How to prepare standard
concentrations
Note that this step is best
accomplished in the lab before
leaving for sampling. Standards
are prepared using a phosphate
standard solution of 3 mg/L as
phosphate (PO4). This is
equivalent to a concentration of
1 mg/L as Phosphorus (P). All
references to concentrations
and results from this point on in
this procedure will be expressed
as mg/L as P, since this is the
convention for reporting results.
Six standard concentrations will
be prepared for every sampling
date in the range of expected
results. For most samples, the
following six concentrations
should be adequate:
| 0.00 mg/L | 0.12 mg/L
|
| 0.04 mg/L | 0.16 mg/L
|
| 0.08 mg/L | 0.20 mg/L
|
Proceed as follows:
- Set out six 25-mL volumetric
flasks one for each standard.
Label the flasks 0.00, 0.04,
0.08, 0.12, 0.16, and 0.20.
- Pour about 30 mL of the
phosphate standard solution into
a 50 mL beaker.
- Use 1-, 2-, 3-, 4-, and 5-mL
Class A volumetric pipets to
transfer corresponding volumes
of phosphate standard solution to each 25-mL
volumetric flask as follows:
Standard
Concentration |
mL of Phosphate
Standard Solution |
| 0.00 | 0 |
| 0.04 | 1 |
| 0.08 | 2 |
| 0.12 | 3 |
| 0.16 | 4 |
| 0.20 | 5 |
Note: The standard solution is calculated based on the
equation: A = (B x C) � D
Where:
A = mL of standard solution needed
B = desired concentration of standard
C = final volume (mL) of standard
D = concentration of standard solution
For example, to find out how much phosphate standard
solution to use to make a 0.04-mg/L standard:
A = (0.04 x 25) � 1
A = 1 mL
Before transferring the solution, clear each pipet by
filling it once with the standard solution and blowing it
out. Rinse each pipet with deionized water after use.
- Fill the remainder of each 25 mL volumetric flask
with distilled, deionized water to the 25 mL line. Swirl to
mix.
- Set out and label six 50-mL Erlenmeyer flasks: 0.00,
0.04, 0.08, 0.12, 0.16, and 0.20. Pour the standards from
the volumetric flasks to the Erlenmeyer flasks.
- List the standard concentrations (0.00, 0.04,
0.08, 0.12, 0.16, and 0.20) under "Bottle #" on the lab
sheet.
- Analyze each of these standard concentrations as
described in the section below.
How to collect and analyze samples
The field procedures for collecting and analyzing samples for phosphorus consist of the
following tasks:
TASK 1 Prepare the sample containers
If factory-sealed, disposable Whirl-pak® bags are used for sampling, no preparation is needed.
Reused sample containers (and all glassware used in this procedure) must be cleaned (including
acid rinse) before the first run and after each sampling run by following the procedure described
in Method B on page 128. Remember to wear latex gloves.
TASK 2 Prepare before leaving for the sample site
Refer to section 2.3 - Safety Considerations for details on confirming sampling date and time, safety considerations,
checking supplies, and checking weather and directions. In addition to sample containers and the
standard sampling apparel, you will need the following equipment and supplies for total reactive
phosphorus analysis:
- Color comparator or field spectrophotometer with sample tubes for reading the absorbance of
the sample
- Prepackaged reagents (combined reagents) to turn the water blue
- Deionized or distilled water to rinse the sample tubes between uses
- Wash bottle to hold rinse water
- Mixing container with a mark at the recommended sample volume (usually 25 mL) to hold and
mix the sample
- Clean, lint-free wipes to clean and dry the sample tubes
Note that prepackaged reagents are recommended for ease and safety.
TASK 3 Collect the sample
Refer to Task 2 in the Introduction to Chapter 5 for details on
how to collect water samples using screw-cap bottles or Whirl-pak® bags.
TASK 4 Analyze the sample in the field (for total orthophosphate only) using the ascorbic acid method.
If using an electronic spectrophotometer or
colorimeter:
- "Zero" the meter (if you are using one) using a reagent blank
(distilled water plus the reagent powder) and following the
manufacturer's directions.
- Pour the recommended sample volume (usually 25 mL)
into a mixing container and add reagent powder pillows. Swirl
to mix. Wait the recommended time (usually at least 10 minutes)
before proceeding.
- Pour the first field sample into the sample cell test tube.
Wipe the tube with a lint-free cloth to be sure it is clean and
free of smudges or water droplets. Insert the tube into the
sample cell.
- Record the bottle number on the field data sheet.
- Place the cover over the sample cell. Read the
absorbance or concentration of this sample and record it on the
field data sheet.
- Pour the sample back into its flask.
- Rinse the sample cell test tube and mixing container three
times with distilled, deionized water. Avoid touching the lower
portion of the sample cell test tube. Wipe with a clean,
lint-free wipe. Be sure that the lower part of the sample cell
test tube is clean and free of smudges or water droplets.
Be sure to use the same sample
cell test tube for each sample. If
the test tube breaks, use a new
one and repeat step 1 to "zero"
the meter.
If using a color
comparator:
- Follow the manufacturer's
directions. Be sure to pay
attention to the direction of your
light source when reading the
color development. The light
source should be in the same
position relative to the color
comparator for each sample.
Otherwise, this is a source of
significant error. As a quality
check, have someone else read
the comparator after you.
- Record the concentration on
the field data sheet.
TASK 5 Return the
samples (for lab analysis
for other tests) and the
field data sheets to the
lab/drop-off point.
Samples for different types of
phosphorus must be analyzed
within a certain time period. For
some types of phosphorus, this
is a matter of hours; for others,
samples can be preserved and
held for longer periods.
Samples being tested for
orthophosphate must be
analyzed within 48 hours of
collection. In any case, keep the
samples on ice and take them to
the lab or drop-off point as
soon as possible.
TASK 6 Analyze the
samples in the lab.
Lab methods for other tests are
described in the references
below (APHA. 1992; Hach
Company, 1992; River Watch
Network, 1992; USEPA,
1983).
TASK 7 Report the
results and convert to
milligrams per liter
First, absorbance values must
be converted to milligrams per
liter. This is done by
constructing a "standard curve" using the absorbance results from your standard
concentrations.
- Make an absorbance versus concentration graph on graph paper:
- Make the "y" (vertical) axis and label it "absorbance." Mark this axis in
0.05 increments from 0 as high as the graph paper will allow.
- Make the "x" (horizontal) axis and label it "concentration: mg/L as P."
Mark this axis with the concentration of the standards: 0, 0.04, 0.08, 0.12,
0.16, 0.20.
- Plot the absorbance of the standard concentrations on the graph.
- Draw a "best fit" straight line through these points. The line should touch
(or almost touch) each of the points. If it doesn't, make up new standards and
repeat the procedure.
Example: Suppose you measure the absorbance of the six standard
concentrations as follows:
| Concentration | Absorbance |
| 0.00 | 0.000 |
| 0.04 | 0.039 |
| 0.08 | 0.078 |
| 0.12 | 0.105 |
| 0.16 | 0.155 |
| 0.20 | 0.192 |
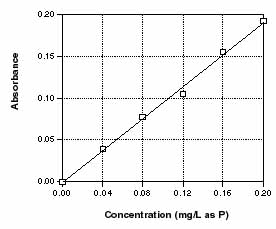
Figure 5.13
Absorbance of standard concentrations, when plotted, should result in a straight line
|
The resulting standard curve is displayed in Fig. 5.13.
- For each sample, locate the absorbance on the "y" axis, read horizontally
over to the line, and then more down to read the concentration in mg/L as P.
- Record the concentration on the lab sheet in the appropriate column.
NOTE: The detection limit for this test is 0.01 mg/L. Report any results less than
0.01 as "<0.01." Round off all results to the nearest hundredth of a mg/L.
Results can either be reported "as P" or "as PO4." Remember that your results are reported
as milligrams per liter weight per unit of volume. Since the PO4 molecule is three times
as heavy as the P atom, results reported as PO4 are three times the concentration of those
reported as P. For example, if you measure 0.06 mg/L as PO4, that's equivalent to 0.02
mg/L as P. To convert PO4 to P, divide by 3. To convert P to PO4, multiply by 3. To
avoid this confusion, and since most state water quality standards are reported as P, this
manual recommends that results always be reported as P.
References
APHA. 1992. Standard methods for the examination of water and wastewater. 18th ed.
American Public Health Association, Washington, DC.
Black, J.A. 1977. Water pollution technology. Reston Publishing Co., Reston, VA.
Caduto, M.J. 1990. Pond and brook. University Press of New England, Hanover, NH.
Dates, Geoff. 1994. Monitoring for phosphorus or how come they don't tell you this stuff in the manual? Volunteer Monitor, Vol. 6(1), spring 1994.
Hach Company. 1992. Hach water analysis handbook. 2nd ed. Loveland, CO.
River Watch Network. 1991. Total phosphorus test (adapted from Standard Methods). July 17.
River Watch Network. 1992. Total phosphorus (persulfate digestion followed by ascorbic acid procedure, Hach adaptation of Standard Methods). July 1.
USEPA. 1983. Methods for chemical analysis of water and wastes. 2nd ed. Method 365.2. U.S. Environmental Protection Agency, Washington, DC.
< Previous · Table of Contents · Next >
Office of Wetlands, Oceans & Watersheds Home
Watershed Protection Home | Monitoring Water Quality Home
EPA Home |
Office of Water |
Search |
Comments