TWENTY-SIX
The Sign of the Beast
It may seem inconsequential to give the neutrino a rest mass for the sake of saving the sun, but in reality the neutrino mass is crucial to Ettore’s theory. Should the neutrino be massless, then the Majorana neutrino would be observationally indistinguishable from its alternative, the Dirac neutrino. Were it not for the neutrino’s inability to move at the speed of light, Dirac versus Majorana would be a matter of taste, like supporting different football teams or belonging to different religions.
Recall that the controversy hinges on how the neutrino reacts to Amis’s backward world—its behavior under a reversal of time’s arrow. Dirac’s neutrino in Amis’s world becomes a distinct particle, the antineutrino. Ettore’s remains the same because Majorana neutrinos already experience a quantum superposition of the two arrows of time. If the neutrino were massless, it would move at the speed of light, and time doesn’t pass for such particles. The faster something moves, the slower time flows. It grinds to a halt for particles moving at the speed of light, so that massless particles like the photon live outside time. If the neutrino were massless, it wouldn’t feel the flow of time, and there could be no distinction between indifference or not to time reversal. The neutrino must be massive for there to be antagonism between Dirac’s and Majorana’s proposals.
That the neutrino mass doesn’t vanish was proved incontrovertibly by the various experiments that established neutrino oscillations (a process that also happens in time, and so requires nonzero rest mass.) In 2002, Ray Davis and Masatoshi Koshiba (representing the Japanese group) won the Nobel Prize for this discovery. The path toward the detection of Ettore’s neutrino was now open.

As early as 1935, Maria Goeppert-Mayer realized that beta decay could exist in a form where two coincident decays happened inside a nucleus. Two neutrons inside the same nucleus could simultaneously, and as part of the same process, convert into two protons releasing two beta rays and two neutrinos. The process is very unlikely and Goeppert-Mayer computed its probability using Fermi’s theory of weak interactions (the one famously rejected by Nature magazine). She found that it was exceedingly rare because it involved two simultaneous interventions of the weak force. The rare decay was unimaginatively christened “double beta decay.”
Because the process is so much rarer than single beta decay, it can only be observed if single beta decay is not possible for a given nucleus. If single beta decay can occur, it completely swamps the double version, releasing beta rays much more copiously. But for some nuclei, single beta decay is forbidden (say, by the energy available or by the need to conserve spin), while double beta decay is allowed. One then has a chance of observing the rare process without the loud noises made by the beta stampede of its more frequent version. Double beta decay was finally observed in the laboratory in 1986.
Barely had Ettore left the world when in 1939 scientists realized that another type of double beta decay was possible. Usually one expects two neutrinos to be emitted along with the two beta rays. Wendel Furry proved that it was possible for such a double beta decay to occur without the emission of any neutrinos provided the neutrino was of the Majorana variety. “Neutrinoless double beta decay” is effectively a double beta decay process in which the two neutrinos that would ordinarily have been emitted annihilate each other. It can only happen if the neutrino is Majorana and has a mass. In fact, the probability of neutrinoless double beta decay is related to the neutrino mass according to a well-established formula. The larger the neutrino mass, the more probable is neutrinoless double beta decay.
But this is killing two birds with one stone! If neutrinoless double beta decay is observed, we will know that the neutrino is Majorana and what its mass is. By contrast, Pontecorvo-style oscillation experiments give us only the mass differences between the mass states plus an angle, quantifying their misalignment with the flavor states. Double beta decay makes Ettore’s idea a choice method for weighing neutrinos, explaining its current popularity with experimentalists.71
Figure 26.1: A Feynman diagram depicting the interaction of two electrons, via the interchange of a virtual photon.
To understand interactions between particles, and the rare type of decay that may reveal Ettore’s neutrino, we must once again appeal to Richard Feynman’s lurid imagination. Not only did he propose that antiparticles are particles going backward in time, Amis-style, but he found an inventive and pictorial way to explain forces and decays. He invented the concept of virtual particles, promoting them to the intermediaries of interaction. He also crafted a useful tool for visualizing quantum processes nowadays called Feynman diagrams.
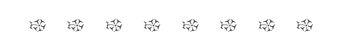
According to Feynman, when two electrons come together and electrically repel, they do so by exchanging a virtual photon; that is, a photon that’s not quite real—virtual light. This is the kind of dark illumination a sun wearing sunglasses would shed: not “free light,” not light you’d ever see. Rather, it’s an obscure sort of light that is permitted only by the fuzziness of quantum mechanics, allowing energy to fluctuate at random for short periods. The virtual photon emitted by the electron isn’t allowed by the conservation laws of classical physics and should never have been emitted. But quantum mechanics turns a blind eye . . . if it’s not for too long. Long enough, however, for the virtual particle to carry energy and momentum between the two electrons, which thus repel (see Figure 26.1).
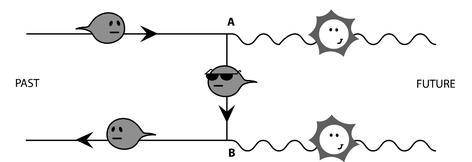
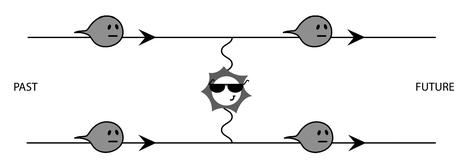
Figure 26.2: The Feynman diagram of an electron-positron annihilation (this is a refinement of Figure 19.3b). Not only does the electron pull a U-turn down the stream of time (to become the positron it annihilates), but it becomes a virtual electron while the photons are being emitted at A and B.
The Feynman diagram of an electron-positron annihilation is also enlightening. As I said earlier, in the Feynman picture of the antiworld, an electron-positron annihilation is like a single particle pulling a U-turn down the stream of time. If a positron is an electron going backward in time, an annihilation is like an electron reversing in time, providing you with the positron you thought you’d started with. Under closer inspection, however, the process involves this “single particle fits all” becoming a virtual particle for a short while (see Figure 26.2). The annihilation releases two photons, at A and B. Traveling between these two points we find a virtual particle, not permitted by classical physics. It can be seen either as a virtual electron travelling from A to B, or as a virtual positron travelling from B to A. The virtual electron is like a moment of “neutral” before the electron engages the full reverse down the stream of time, to become the positron it annihilated.
Virtual photons explain the electric forces between charged particles, and virtual electrons can appear in the Feynman diagrams of annihilations and other quantum processes. And many other virtual particles explain all types of forces, decays, and interactions, including the weak and strong nuclear force. If you think this is crazy, take note of the following: Feynman diagrams can be rigorously and mathematically derived from quantum theory; and they can be employed to predict particle interactions to a ridiculously high standard. Some particle physics quantities have been predicted to one part in 10,000,000,000 by Feynman’s calculations.
In particular, Feynman diagrams can be drawn to explain beta decay. In beta decay diagrams, if the neutrino is seen à la Dirac, it must have an arrow like the electron, to distinguish between particle and antiparticle. For lepton number to be conserved, in beta decay an antineutrino must be emitted, so that the arrows flow continuously from the neutrino to the electron (recall Figure 19.4). Normal double beta decay is just two such disconnected diagrams happening at the same time (see Figure 26.3). If the neutrino is Dirac, there’s no way of connecting the two diagrams, say, by linking the neutrinos (forming a virtual line between the two decays,) because their arrows would clash. A emits an antineutrino and wants it to be absorbed by B. But this would mean B emitting a neutrino, whereas instead it emits an antineutrino (see Figure 26.3). Neutrinoless double beta decay is therefore not possible in Dirac’s picture.
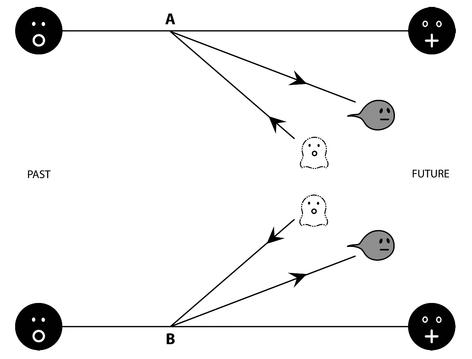
Figure 26.3: Double beta decay with neutrino emission is just two disconnected diagrams for beta decay happening at the same time. If the neutrino is Dirac (as in this figure) it has a definite arrow and so a clear particle-antiparticle nature. Therefore it’s impossible to connect the neutrinos coming from A and B to make them virtual and achieve neutrinoless double beta decay.
The story is altogether different with Majorana neutrinos, explaining Wendel Furry’s insight. In Feynman diagrams Ettore’s neutrinos are represented idiosyncratically because they flow both ways in time, representing particle and antiparticle in one. Thus they’re represented as lines with arrows pointing both ways (recall Figure 19.5.)
Figure 26.4: But Majorana neutrinos are “bi-timal”: Their time flow, or their particle-antiparticlecontrol, goes both ways down their lines. Thus the two beta-decay diagrams can be linked via a virtual neutrino without a clash. The neutrinoless double beta decay is the hallmark of the Majorana neutrino.
We can now see why neutrinoless double beta decay is possible should the neutrino be Majorana. Because the time flow, or the particle-antiparticle control, goes both ways down their lines, we can link the neutrino lines belonging to the two diagrams without a clash (see Figure 26.4). The Majorana neutrino can annihilate itself, and effectively that’s what happens inside the diagram of neutrinoless double beta decay. It’s the sign of the beast: of Ettore’s beast. And that’s how one hopes to bring it to light.

So here’s a blast from the past. Even as we delve into twenty-first-century neutrino experiments, we return to where it all started: the spectrum of beta decay. Physicists work by analogy, so it’s interesting to find out what was on their minds during those days long ago when Pauli and Ettore were first messing about with neutrinos. When I started my physics studies, it was firmly believed that the neutrino was massless; but at its inception, in the 1930s, it was never meant to be massless. It was quickly realized that its mass had to be much smaller than the electron mass. Still, no one assumed it to be zero. But how did they know that the neutrino mass had to be so small?
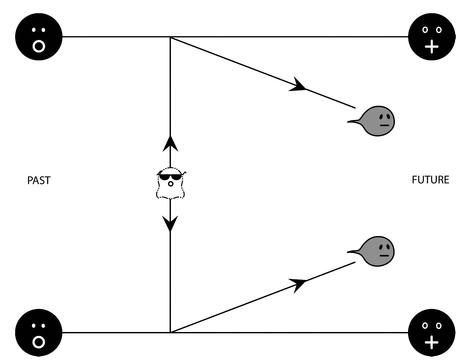
Recall my early diagram, showing how the energy “spectrum” of beta rays pointed Pauli toward a third man, the neutrino: the carrier of vanished energy. You had two nuclei with different masses, the daughter being lighter than the mother by ΔM. This means that an equivalent energy E (equal to ΔMc2) was available, and should by rights have been carried by the electron; i.e., the beta ray. The expectation was for the beta ray spectrum to be a sharp line around this energy, which was the same for each mother and daughter pair (see Figure 26.5). Instead the beta ray spectrum showed a range of possible energies, all smaller than this amount, following a smooth line (see Figure 26.6).
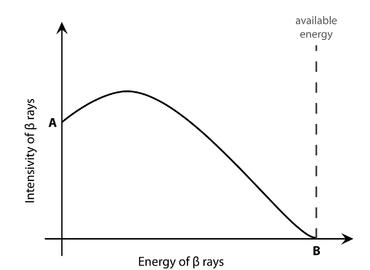
Energy conservation was salvaged by Pauli’s proposal of the neutrino. The observed electron spectrum revealed that the electron was sharing the available energy with a mystery particle—invisible, intangible. Near point A of the spectrum, the neutrino carried all the available energy, E, so there was nothing left for the electron. Near point B, the electron instead carried the lot, the neutrino being left with nothing. In between, they’d share energy E. Right?
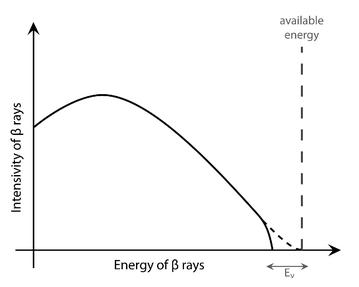
Almost. Point B, the “end-point of beta decay,” as we call it nowadays, represents the minimum energy that can be given to the neutrino (it is the maximum energy we ever see the electron carrying). This is only the full E if the neutrino is massless, because then you can give it an energy as close to zero as wanted. But if the neutrino is massive you have to give it at least its rest mass. Therefore the maximum you can give the beta ray is not E, but E minus the neutrino rest energy (E ν = mνc2); see Figure 26.7.
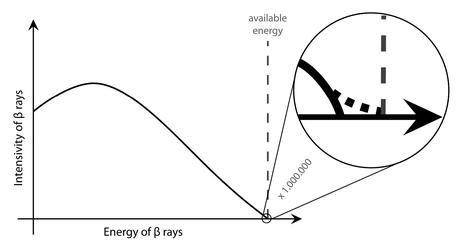
Sounds easy? Let me put the picture to scale (see Figure 26.8). To this day no one has measured the neutrino mass using this method. We do know, however, that it has to be much smaller than the electron mass, indeed at least a million times smaller, because the end-point of beta decay is very close to point B.
Figure 26.5: The expected spectrum of (single) beta decay, before physicists were forced to face up to the neutrino.
Figure 26.6: The spectrum of (single) beta decay as it was observed. At point A, the neutrino carries all the available energy (so that none is left for the electron, or beta ray.) At point B, the neutrino carries none.
Figure 26.7: A correction for what happens at B, given the neutrino rest mass (and so its rest energy E ν = m νc2.) The neutrino must carry at least this energy, so the beta ray can never absorb all the available energy. The end point of beta decay, in principle, would offer us a method to measure the neutrino mass.
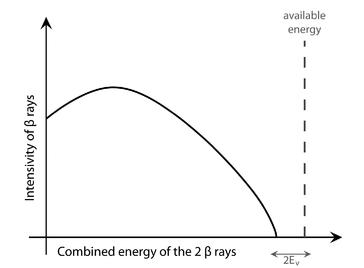
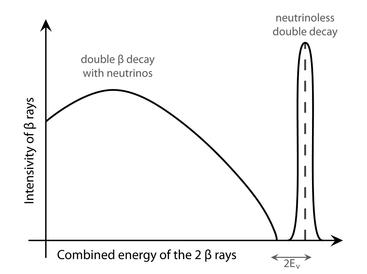
Figure 26.9: The spectrum of double beta decay with production of neutrinos. When the energies of the two electrons (beta rays) are added up we observe a curve starting at zero and ending at the available energy minus twice the neutrino mass (since we must now feed two neutrinos).
Figure 26.10: The spectrum of neutrinoless double beta decay, instead, reproduces the expectation for the spectrum of beta decay before the neutrino entered the picture: a sharp line centered at the available energy.
But in this context, the spectrum of double beta decay is precisely a combination of the energy spectrum scientists expected to see in 1930 and that which was in fact observed. Life is a long circle. If double beta decay occurs with production of neutrinos, when we add up the energies of the two electrons coincidentally emitted we get a smooth spectrum, starting at zero and ending at the available mass-energy ΔM minus twice the neutrino mass (see Figure 26.9). But if no neutrinos are emitted we get, of course, what was expected before Pauli was forced to dream up the neutrino: a sharp line at the available energy (see Figure 26.10). Ironically, the signature of the Majorana neutrino is precisely what physicists expected before they knew about neutrinos—because it marks beta decay without them. Majorana’s neutrino leaves its mark by not being emitted, because it self-annihilates, thus failing to imprint on the spectrum the energy deficit which revealed the neutrino in the first place.
It’s bizarre that the sign of the beast is self-annihilation. Ettore’s neutrino is the most self-destructive particle in the cosmos—like its creator.